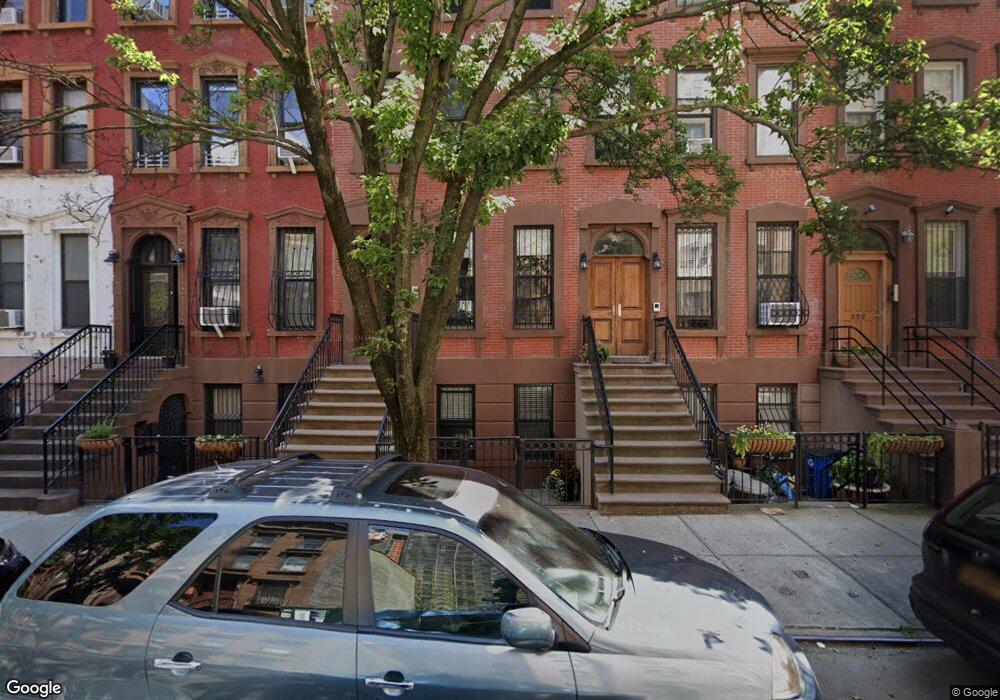
220 W 123rd St New York, NY 10027
Central Harlem NeighborhoodEstimated Value: $1,264,000 - $2,932,000
--
Bed
--
Bath
3,024
Sq Ft
$712/Sq Ft
Est. Value
About This Home
This home is located at 220 W 123rd St, New York, NY 10027 and is currently estimated at $2,153,701, approximately $712 per square foot. 220 W 123rd St is a home located in New York County with nearby schools including P.S. 76 A Phillip Randolph, Neighborhood Charter School of Harlem, and Mt Pleasant Christian Academy.
Ownership History
Date
Name
Owned For
Owner Type
Purchase Details
Closed on
Jun 13, 2007
Sold by
Shacov Development Llc
Bought by
White Jeffrey O and White Rebecca J
Current Estimated Value
Home Financials for this Owner
Home Financials are based on the most recent Mortgage that was taken out on this home.
Original Mortgage
$183,833
Outstanding Balance
$112,791
Interest Rate
6.24%
Estimated Equity
$2,040,910
Purchase Details
Closed on
Jun 28, 2005
Sold by
City Of New York
Bought by
Shacov Development Llc
Home Financials for this Owner
Home Financials are based on the most recent Mortgage that was taken out on this home.
Original Mortgage
$1,254,941
Interest Rate
5.67%
Mortgage Type
Purchase Money Mortgage
Create a Home Valuation Report for This Property
The Home Valuation Report is an in-depth analysis detailing your home's value as well as a comparison with similar homes in the area
Home Values in the Area
Average Home Value in this Area
Purchase History
| Date | Buyer | Sale Price | Title Company |
|---|---|---|---|
| White Jeffrey O | $666,275 | -- | |
| White Jeffrey O | $666,275 | -- | |
| Shacov Development Llc | -- | -- | |
| Shacov Development Llc | -- | -- |
Source: Public Records
Mortgage History
| Date | Status | Borrower | Loan Amount |
|---|---|---|---|
| Open | White Jeffrey O | $183,833 | |
| Closed | White Jeffrey O | $183,833 | |
| Previous Owner | White Jeffrey O | $173,000 | |
| Previous Owner | Shacov Development Llc | $1,254,941 | |
| Closed | Shacov Development Llc | $741,116 |
Source: Public Records
Tax History Compared to Growth
Tax History
| Year | Tax Paid | Tax Assessment Tax Assessment Total Assessment is a certain percentage of the fair market value that is determined by local assessors to be the total taxable value of land and additions on the property. | Land | Improvement |
|---|---|---|---|---|
| 2025 | $7,589 | $40,049 | $10,575 | $29,474 |
| 2024 | $7,589 | $37,782 | $33,540 | $27,564 |
| 2023 | $6,934 | $35,644 | $8,468 | $27,176 |
| 2022 | $6,413 | $143,220 | $33,540 | $109,680 |
| 2021 | $6,761 | $141,180 | $33,540 | $107,640 |
| 2020 | $6,747 | $160,800 | $33,540 | $127,260 |
| 2019 | $6,273 | $157,440 | $33,540 | $123,900 |
| 2018 | $5,749 | $29,703 | $7,065 | $22,638 |
| 2017 | $5,406 | $28,022 | $7,836 | $20,186 |
| 2016 | $5,302 | $28,022 | $10,577 | $17,445 |
| 2015 | $918 | $27,812 | $15,744 | $12,068 |
| 2014 | $918 | $26,238 | $9,613 | $16,625 |
Source: Public Records
Map
Nearby Homes
- 216 W 123rd St
- 203 W 122nd St Unit 4
- 240 W 123rd St Unit TERRA
- 265 W 122nd St Unit C
- 157 W 123rd St Unit 2D
- 157 W 123rd St Unit 2C
- 157 W 123rd St Unit 3E
- 157 W 123rd St Unit 5-E
- 157 W 123rd St Unit 2A
- 157 W 123rd St Unit 4C
- 271 W 122nd St Unit 1
- 2280 Frederick Douglass Blvd Unit 2-G
- 2280 Frederick Douglass Blvd Unit 9-F
- 2280 Frederick Douglass Blvd Unit 11D
- 2280 Frederick Douglass Blvd Unit 11-E
- 148 W 123rd St
- 267 W 124th St Unit 4B
- 2300 Frederick Douglass Blvd Unit 11B
- 2300 Frederick Douglass Blvd Unit 9F
- 260 W 121st St
- 222 W 123rd St
- 224 W 123rd St
- 218 W 123rd St
- 226 W 123rd St
- 226 W 123rd St Unit 2
- 226 W 123rd St Unit 3
- 216 W 123rd St Unit 2
- 228 W 123rd St
- 228 W 123rd St Unit 3
- 228 W 123rd St Unit 2
- 214 W 123rd St
- 212 W 123rd St
- 212 W 123rd St Unit 4
- 212 W 123rd St Unit 1
- 212 W 123rd St Unit 2
- 212 W 123rd St Unit 5
- 212 W 123rd St Unit 3
- 230 W 123rd St
- 230 W 123rd St Unit 1C
- 230 W 123rd St