220 W 800 N Pleasant Grove, UT 84062
Estimated Value: $441,292 - $515,000
2
Beds
2
Baths
900
Sq Ft
$530/Sq Ft
Est. Value
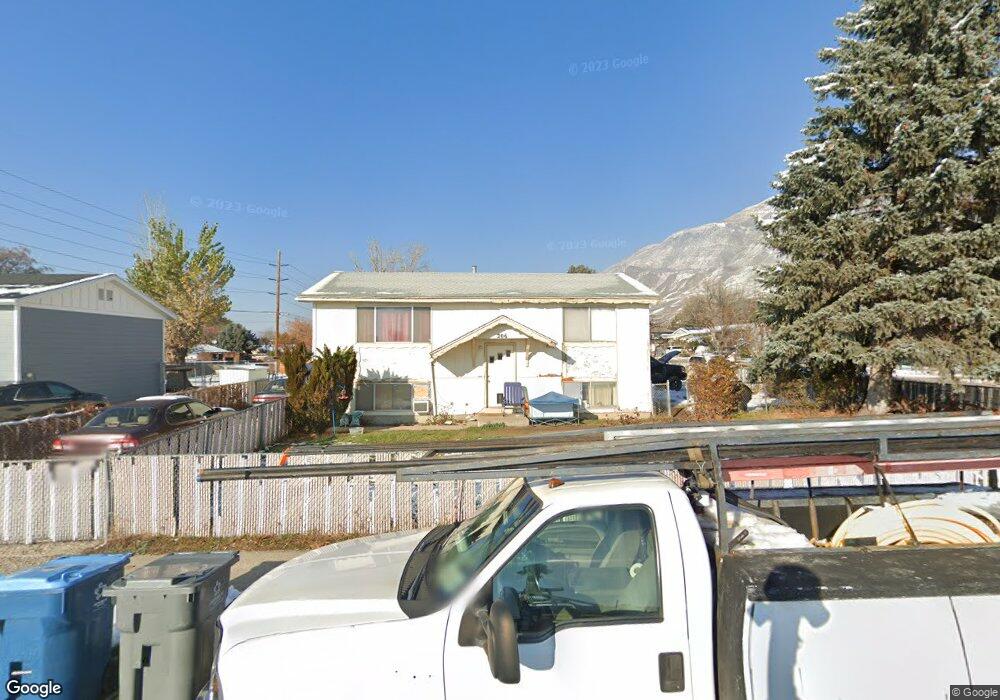
About This Home
This home is located at 220 W 800 N, Pleasant Grove, UT 84062 and is currently estimated at $476,573, approximately $529 per square foot. 220 W 800 N is a home located in Utah County with nearby schools including Mount Mahogany School, Pleasant Grove Junior High School, and Pleasant Grove High School.
Ownership History
Date
Name
Owned For
Owner Type
Purchase Details
Closed on
Mar 12, 2020
Sold by
Clark Steve Elven
Bought by
Clark Steve Elven and Clark Jeanette
Current Estimated Value
Purchase Details
Closed on
Feb 3, 2020
Sold by
Clark Steven Elvin
Bought by
Clark Steven Elvin and Clark Jeanette
Purchase Details
Closed on
Aug 22, 2014
Sold by
Clark Steve Elven and Clark Jeanette
Bought by
Clark Chris W
Create a Home Valuation Report for This Property
The Home Valuation Report is an in-depth analysis detailing your home's value as well as a comparison with similar homes in the area
Home Values in the Area
Average Home Value in this Area
Purchase History
| Date | Buyer | Sale Price | Title Company |
|---|---|---|---|
| Clark Steve Elven | -- | None Available | |
| Clark Steven Elvin | -- | None Available | |
| Clark Chris W | -- | None Available |
Source: Public Records
Tax History Compared to Growth
Tax History
| Year | Tax Paid | Tax Assessment Tax Assessment Total Assessment is a certain percentage of the fair market value that is determined by local assessors to be the total taxable value of land and additions on the property. | Land | Improvement |
|---|---|---|---|---|
| 2025 | $1,824 | $226,380 | $195,500 | $216,100 |
| 2024 | $1,824 | $217,745 | $0 | $0 |
| 2023 | $1,802 | $220,165 | $0 | $0 |
| 2022 | $1,850 | $224,840 | $0 | $0 |
| 2021 | $1,595 | $295,300 | $140,300 | $155,000 |
| 2020 | $1,467 | $266,200 | $125,300 | $140,900 |
| 2019 | $1,266 | $237,600 | $115,100 | $122,500 |
| 2018 | $1,192 | $211,500 | $105,000 | $106,500 |
| 2017 | $1,132 | $106,975 | $0 | $0 |
| 2016 | $1,136 | $103,620 | $0 | $0 |
| 2015 | $1,105 | $95,425 | $0 | $0 |
| 2014 | $1,032 | $88,330 | $0 | $0 |
Source: Public Records
Map
Nearby Homes
- 1152 N 200 W
- 685 W 1000 N
- 405 N 200 E
- 825 N 350 E
- 344 E 900 N
- 854 N 1010 W
- 1051 N 600 W
- 1031 N 600 W
- 1041 N 600 W
- 909 W 1180 N
- 146 N 200 E
- 1656 N Siena Cir Unit 7
- 1534 N 750 W Unit 16
- 731 W 1590 N Unit 15
- Konlee Plan at Makin Dreams
- Alexa Plan at Makin Dreams
- Callahan Plan at Makin Dreams
- Hailey Plan at Makin Dreams
- Alydia Plan at Makin Dreams
- Addison Plan at Makin Dreams