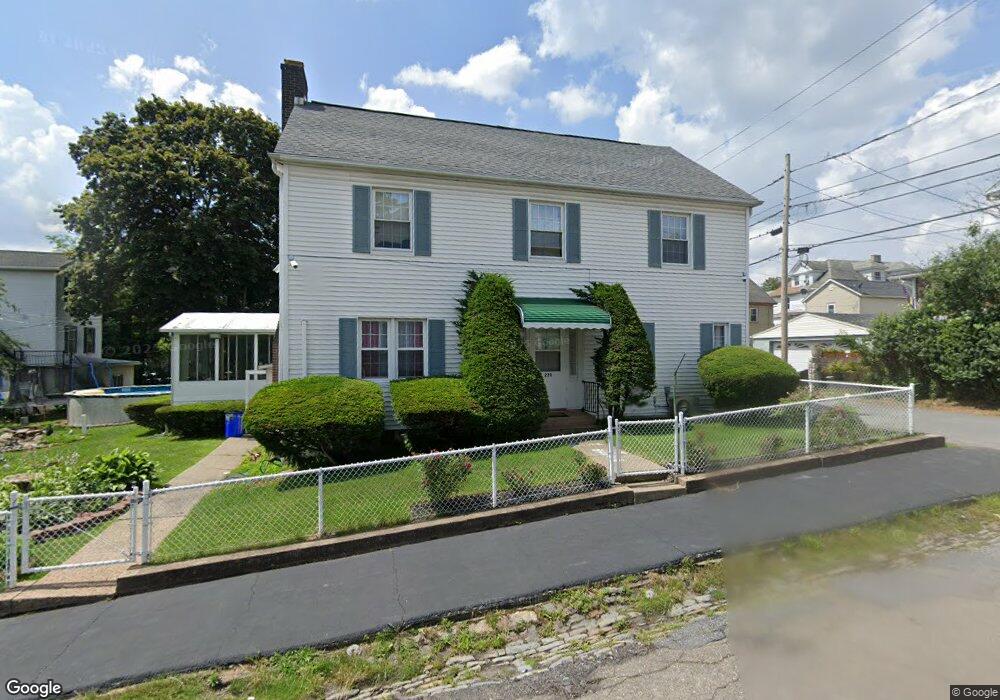
220 W Oak St Hazleton, PA 18201
Estimated Value: $278,000 - $417,000
6
Beds
4
Baths
2,392
Sq Ft
$143/Sq Ft
Est. Value
About This Home
This home is located at 220 W Oak St, Hazleton, PA 18201 and is currently estimated at $342,532, approximately $143 per square foot. 220 W Oak St is a home located in Luzerne County with nearby schools including Hazleton Area High School, Holy Family Academy, and Immanuel Christian School.
Ownership History
Date
Name
Owned For
Owner Type
Purchase Details
Closed on
Nov 6, 2020
Sold by
Carrasco Yinmy and Paulino Cynthia
Bought by
Dela Cruz Garcia Jeison A
Current Estimated Value
Home Financials for this Owner
Home Financials are based on the most recent Mortgage that was taken out on this home.
Original Mortgage
$236,634
Outstanding Balance
$210,571
Interest Rate
2.8%
Mortgage Type
FHA
Estimated Equity
$131,961
Purchase Details
Closed on
Jan 12, 2009
Sold by
Smith Harvey M and Smith Nan L
Bought by
Carrasco Yinmy and Paulino Cynthia
Home Financials for this Owner
Home Financials are based on the most recent Mortgage that was taken out on this home.
Original Mortgage
$127,319
Interest Rate
5.2%
Mortgage Type
FHA
Create a Home Valuation Report for This Property
The Home Valuation Report is an in-depth analysis detailing your home's value as well as a comparison with similar homes in the area
Home Values in the Area
Average Home Value in this Area
Purchase History
| Date | Buyer | Sale Price | Title Company |
|---|---|---|---|
| Dela Cruz Garcia Jeison A | $241,000 | None Available | |
| Carrasco Yinmy | $129,000 | None Available |
Source: Public Records
Mortgage History
| Date | Status | Borrower | Loan Amount |
|---|---|---|---|
| Open | Dela Cruz Garcia Jeison A | $236,634 | |
| Previous Owner | Carrasco Yinmy | $127,319 |
Source: Public Records
Tax History Compared to Growth
Tax History
| Year | Tax Paid | Tax Assessment Tax Assessment Total Assessment is a certain percentage of the fair market value that is determined by local assessors to be the total taxable value of land and additions on the property. | Land | Improvement |
|---|---|---|---|---|
| 2025 | $4,056 | $141,200 | $24,100 | $117,100 |
| 2024 | $3,800 | $141,200 | $24,100 | $117,100 |
| 2023 | $3,552 | $141,200 | $24,100 | $117,100 |
| 2022 | $3,526 | $141,200 | $24,100 | $117,100 |
| 2021 | $3,445 | $141,200 | $24,100 | $117,100 |
| 2020 | $3,078 | $141,200 | $24,100 | $117,100 |
| 2019 | $3,176 | $141,200 | $24,100 | $117,100 |
| 2018 | $3,068 | $141,200 | $24,100 | $117,100 |
| 2017 | $2,828 | $141,200 | $24,100 | $117,100 |
| 2016 | $1,625 | $141,200 | $24,100 | $117,100 |
| 2015 | $1,594 | $141,200 | $24,100 | $117,100 |
| 2014 | $1,594 | $141,200 | $24,100 | $117,100 |
Source: Public Records
Map
Nearby Homes
- 56 N Laurel St
- 52 N Laurel St
- 163 N Church St
- 1087 N Rear Locust St
- 127 W Diamond Ave
- 522 N James St
- 530 N Lee Ct
- 572 N Vine St
- ER.126 W Aspen St
- 90 N Cedar St
- 523 N Laurel St
- 132 E Chestnut St
- 137 W Birch St
- 538 Carson St Unit 40
- 14 W 5th St
- 26 N Tahkox Dr
- Lot 46 Mountain Laurel Dr
- 14 Nicole Ln
- 220 E Birch St
- 714 Alter St