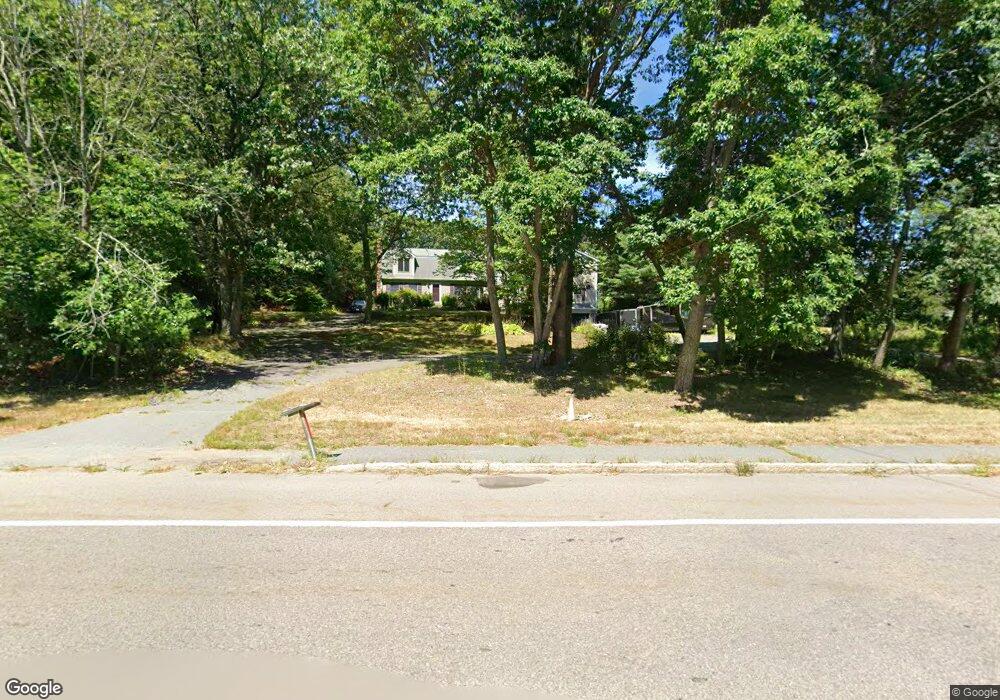
220 West St Wrentham, MA 02093
Estimated Value: $713,000 - $836,000
4
Beds
3
Baths
3,372
Sq Ft
$230/Sq Ft
Est. Value
About This Home
This home is located at 220 West St, Wrentham, MA 02093 and is currently estimated at $776,231, approximately $230 per square foot. 220 West St is a home located in Norfolk County with nearby schools including Delaney Elementary School, Charles E Roderick, and Mercymount Country Day School.
Ownership History
Date
Name
Owned For
Owner Type
Purchase Details
Closed on
Nov 8, 2023
Sold by
Booth Judith N Est and Booth
Bought by
Booth Charles A
Current Estimated Value
Purchase Details
Closed on
Jan 30, 2004
Sold by
Dalton Thomas W and Dalton Lisa J
Bought by
Booth Charles A and Booth Melissa T
Home Financials for this Owner
Home Financials are based on the most recent Mortgage that was taken out on this home.
Original Mortgage
$228,000
Interest Rate
5.82%
Mortgage Type
Purchase Money Mortgage
Create a Home Valuation Report for This Property
The Home Valuation Report is an in-depth analysis detailing your home's value as well as a comparison with similar homes in the area
Home Values in the Area
Average Home Value in this Area
Purchase History
| Date | Buyer | Sale Price | Title Company |
|---|---|---|---|
| Booth Charles A | -- | None Available | |
| Booth Charles A | $285,000 | -- |
Source: Public Records
Mortgage History
| Date | Status | Borrower | Loan Amount |
|---|---|---|---|
| Previous Owner | Booth Charles A | $73,000 | |
| Previous Owner | Booth Charles A | $228,000 | |
| Previous Owner | Booth Charles A | $83,300 |
Source: Public Records
Tax History Compared to Growth
Tax History
| Year | Tax Paid | Tax Assessment Tax Assessment Total Assessment is a certain percentage of the fair market value that is determined by local assessors to be the total taxable value of land and additions on the property. | Land | Improvement |
|---|---|---|---|---|
| 2025 | $8,125 | $701,000 | $262,800 | $438,200 |
| 2024 | $8,280 | $690,000 | $262,800 | $427,200 |
| 2023 | $8,440 | $668,800 | $238,800 | $430,000 |
| 2022 | $7,842 | $573,700 | $232,200 | $341,500 |
| 2021 | $8,059 | $572,800 | $217,000 | $355,800 |
| 2020 | $6,444 | $452,200 | $165,600 | $286,600 |
| 2019 | $6,152 | $435,700 | $149,100 | $286,600 |
| 2018 | $6,908 | $485,100 | $149,300 | $335,800 |
| 2017 | $6,802 | $477,300 | $146,400 | $330,900 |
| 2016 | $6,664 | $466,700 | $142,100 | $324,600 |
| 2015 | $6,713 | $448,100 | $151,800 | $296,300 |
| 2014 | $6,660 | $435,000 | $146,000 | $289,000 |
Source: Public Records
Map
Nearby Homes
- 791 South St Unit 5
- 50 Green St
- 80 Carriage House Ln
- 1204 South St
- 440 Chestnut St
- 1222 South St
- Lot 1 - Blueberry 2 Car Plan at King Philip Estates
- Lot 8 - Blueberry 2 Car Plan at King Philip Estates
- Lot 5 - Hughes 2 car Plan at King Philip Estates
- Lot 6 - Blueberry 3 Car Plan at King Philip Estates
- Lot 2 - Camden 2 Car Plan at King Philip Estates
- Lot 7 - Cedar Plan at King Philip Estates
- Lot 4 - Hemingway 2 Car Plan at King Philip Estates
- Lot 3 - Blueberry 2 Car Plan at King Philip Estates
- Lot 3 - 14 Earle Stewart Ln
- 11 Earle Stewart Ln
- 131 Creek St Unit 7
- 4 Munroe Dr
- 955 Summer St
- 19 Chestnut Lot 0