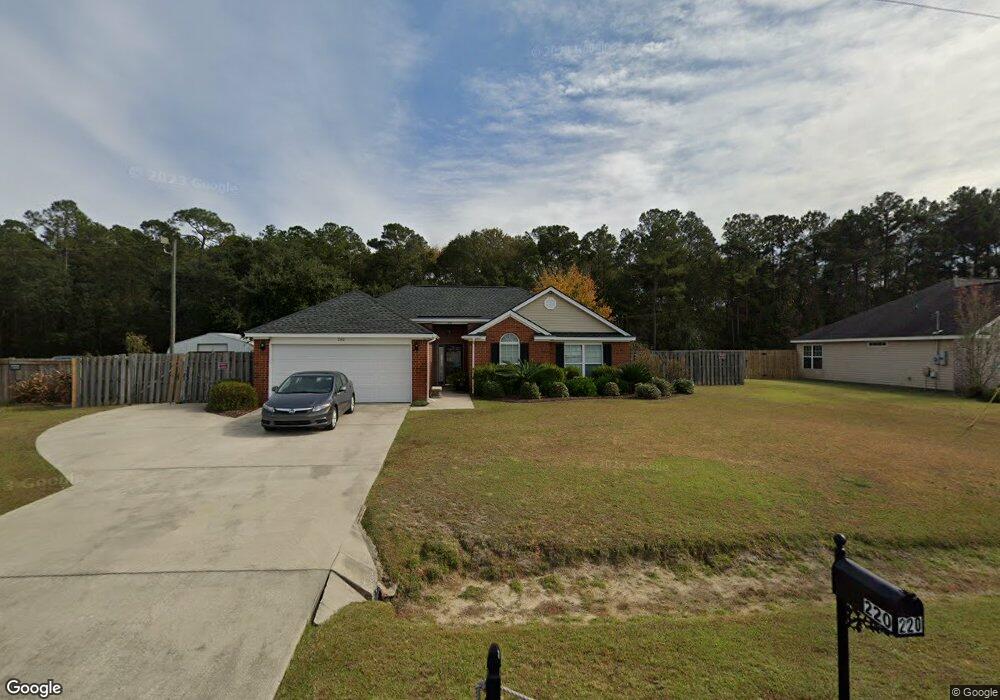
220 Zachary Trail Ellabell, GA 31308
Estimated Value: $282,165 - $296,000
3
Beds
2
Baths
1,409
Sq Ft
$204/Sq Ft
Est. Value
About This Home
This home is located at 220 Zachary Trail, Ellabell, GA 31308 and is currently estimated at $288,041, approximately $204 per square foot. 220 Zachary Trail is a home located in Bryan County with nearby schools including Lanier Primary School, Bryan County Elementary School, and Bryan County Middle School.
Ownership History
Date
Name
Owned For
Owner Type
Purchase Details
Closed on
Oct 11, 2013
Sold by
Polk W K
Bought by
Stanfield James Dean and Stanfield Sheri L
Current Estimated Value
Purchase Details
Closed on
Nov 23, 2005
Sold by
Saviskas Narayan J
Bought by
Saviskas Narayan J and Saviskas Amy L
Home Financials for this Owner
Home Financials are based on the most recent Mortgage that was taken out on this home.
Original Mortgage
$141,391
Interest Rate
6.1%
Mortgage Type
VA
Purchase Details
Closed on
Nov 22, 2005
Sold by
Horizon Home Builders Of S
Bought by
Saviskas Narayan J
Home Financials for this Owner
Home Financials are based on the most recent Mortgage that was taken out on this home.
Original Mortgage
$141,391
Interest Rate
6.1%
Mortgage Type
VA
Purchase Details
Closed on
Mar 23, 2005
Sold by
English Development Group Llc
Bought by
Horizon Home Builders Of Savannah Llc
Create a Home Valuation Report for This Property
The Home Valuation Report is an in-depth analysis detailing your home's value as well as a comparison with similar homes in the area
Home Values in the Area
Average Home Value in this Area
Purchase History
| Date | Buyer | Sale Price | Title Company |
|---|---|---|---|
| Stanfield James Dean | -- | -- | |
| Saviskas Narayan J | -- | -- | |
| Saviskas Narayan J | $136,875 | -- | |
| Horizon Home Builders Of Savannah Llc | $198,000 | -- |
Source: Public Records
Mortgage History
| Date | Status | Borrower | Loan Amount |
|---|---|---|---|
| Previous Owner | Saviskas Narayan J | $141,391 |
Source: Public Records
Tax History Compared to Growth
Tax History
| Year | Tax Paid | Tax Assessment Tax Assessment Total Assessment is a certain percentage of the fair market value that is determined by local assessors to be the total taxable value of land and additions on the property. | Land | Improvement |
|---|---|---|---|---|
| 2024 | $2,361 | $91,760 | $12,800 | $78,960 |
| 2023 | $2,298 | $89,560 | $12,800 | $76,760 |
| 2022 | $1,804 | $69,120 | $15,360 | $53,760 |
| 2021 | $1,625 | $60,840 | $12,800 | $48,040 |
| 2020 | $1,484 | $59,640 | $11,600 | $48,040 |
| 2019 | $1,581 | $58,400 | $11,600 | $46,800 |
| 2018 | $1,442 | $55,320 | $11,600 | $43,720 |
| 2017 | $1,279 | $52,560 | $8,800 | $43,760 |
| 2016 | $1,258 | $51,280 | $8,800 | $42,480 |
| 2015 | $1,253 | $50,880 | $8,800 | $42,080 |
| 2014 | $1,162 | $47,120 | $8,800 | $38,320 |
Source: Public Records
Map
Nearby Homes
- 210 Zachary Trail
- 35 Bonnie Cir
- 310 Bonnie Cir
- 35 Oscar Ct
- 120 Bonnie Cir
- 285 Creekside Cir
- 105 Creekside Cir
- 190 Freeman Dr
- 628 Toni Branch Rd
- 725 Blue Gill Rd
- 0 Ga 204 Hwy Unit 328802
- 335 Joshua Cir
- 397 Pine Ridge Dr
- 58 Pine Ridge Ct
- 410 Joshua Cir
- 89 Wade Carter Rd
- 8 Palmetto Dr
- 2599 Black Creek Church Rd
- 479 Mannie English Rd
- 100 Hallelujah Trail
- 230 Zachary Trail
- 205 Zachary Trail
- 200 Zachary Trail
- 240 Zachary Trail
- 245 Zachary Trail
- 250 Zachary Trail
- 190 Zachary Trail
- 195 Zachary Trail
- 185 Zachary Trail
- 255 Zachary Trail
- 260 Zachary Trail
- 180 Zachary Trail
- 175 Zachary Trail
- 270 Zachary Trail
- 265 Zachary Trail
- 170 Zachary Trail
- 165 Zachary Trail
- 280 Zachary Trail
- 275 Zachary Trail
- 290 Zachary Trail