C
Landlord's Agent in 2019
Cliff Glansen
FLATFLEE.COM INC
(877) 575-5505
4 in this area
2,753 Total Sales
Estimated Value: $178,034 - $194,000
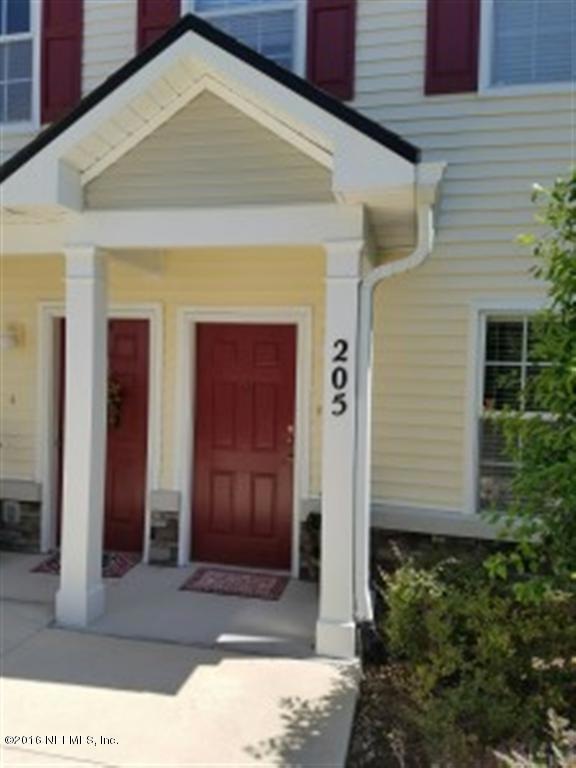
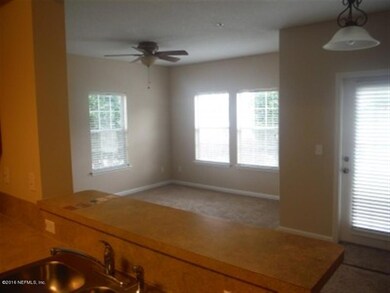
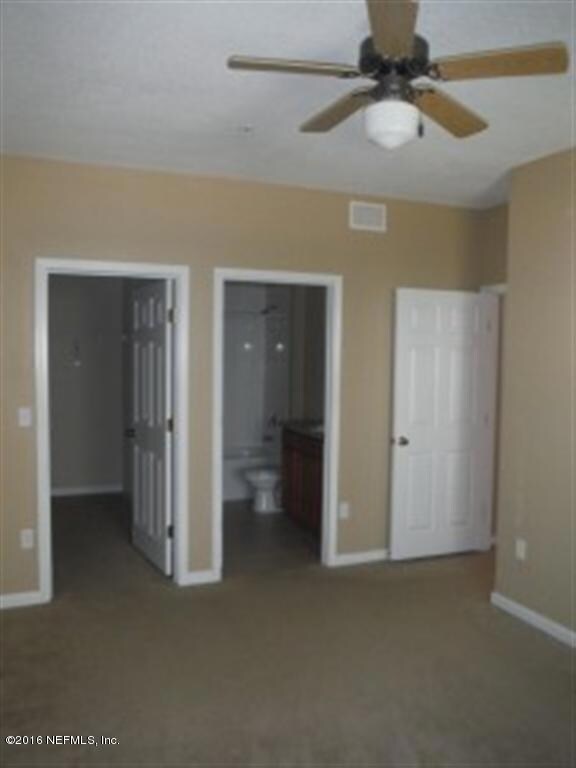
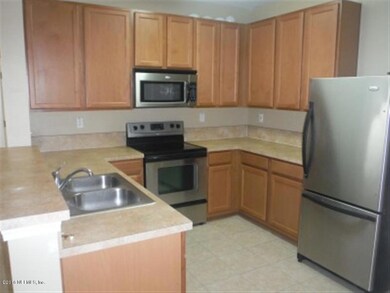
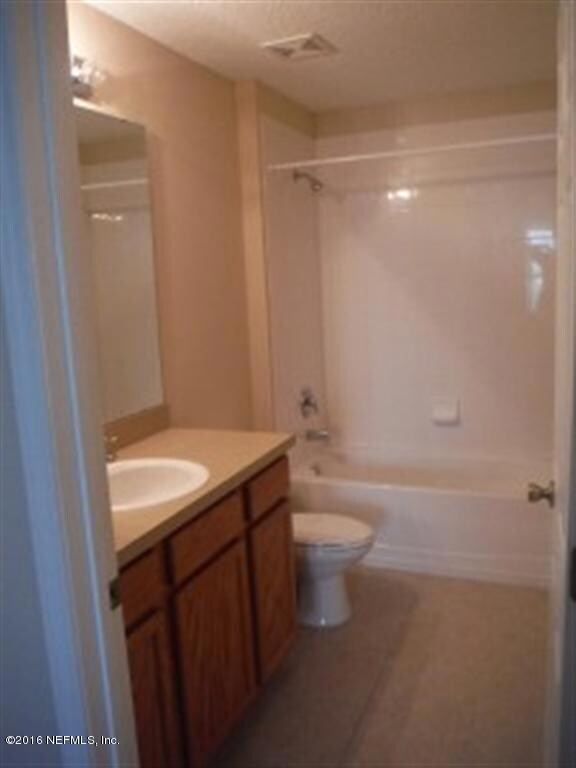
Low maintenance first floor condo, located in beautiful, family friendly and highly sought after Fleming Island Plantation with full amenities including clubhouse, splash park, golf, sports fields, tennis courts, and close to A-rated schools, YMCA, pre-schools, and new public library, theater, shopping and restaurants. Solid oak cabinets, tile in all wet areas, new carpet and paint throughout and all appliances including washer and dryer. Very quiet neighborhood and a perfect place for a single, couple or small family. This is a no-smoking home. All HOA costs are paid by the property owner. Tenants have free access to all amenities.
Last Agent to Rent the Property
FLATFLEE.COM INC License #278017259 Listed on: 09/18/2019
| Date | Buyer | Sale Price | Title Company |
|---|---|---|---|
| Braman Frederick A | $75,500 | Homeguard Title & Trust Llc | |
| Mcavoy Donald L F | -- | Attorney | |
| Mcavoy Donald | $74,000 | None Available |
| Date | Event | Price | List to Sale | Price per Sq Ft | Prior Sale |
|---|---|---|---|---|---|
| 12/17/2023 12/17/23 | Off Market | $1,190 | -- | -- | |
| 12/17/2023 12/17/23 | Off Market | $1,050 | -- | -- | |
| 12/17/2023 12/17/23 | Off Market | $1,000 | -- | -- | |
| 12/17/2023 12/17/23 | Off Market | $850 | -- | -- | |
| 12/17/2023 12/17/23 | Off Market | $74,000 | -- | -- | |
| 10/10/2019 10/10/19 | Rented | $1,190 | 0.0% | -- | |
| 10/05/2019 10/05/19 | Under Contract | -- | -- | -- | |
| 09/19/2019 09/19/19 | For Rent | $1,190 | +13.3% | -- | |
| 03/19/2018 03/19/18 | Rented | $1,050 | 0.0% | -- | |
| 03/14/2018 03/14/18 | For Rent | $1,050 | +5.0% | -- | |
| 03/09/2018 03/09/18 | Under Contract | -- | -- | -- | |
| 10/19/2016 10/19/16 | Rented | $1,000 | -4.8% | -- | |
| 10/12/2016 10/12/16 | Under Contract | -- | -- | -- | |
| 10/04/2016 10/04/16 | For Rent | $1,050 | 0.0% | -- | |
| 07/23/2013 07/23/13 | Sold | $74,000 | +5.7% | $71 / Sq Ft | View Prior Sale |
| 07/07/2013 07/07/13 | Pending | -- | -- | -- | |
| 07/05/2013 07/05/13 | For Sale | $70,000 | 0.0% | $67 / Sq Ft | |
| 06/01/2012 06/01/12 | Rented | $850 | 0.0% | -- | |
| 05/29/2012 05/29/12 | Under Contract | -- | -- | -- | |
| 05/07/2012 05/07/12 | For Rent | $850 | -- | -- |
| Year | Tax Paid | Tax Assessment Tax Assessment Total Assessment is a certain percentage of the fair market value that is determined by local assessors to be the total taxable value of land and additions on the property. | Land | Improvement |
|---|---|---|---|---|
| 2025 | $2,135 | $177,690 | $1 | $177,689 |
| 2024 | $3,176 | $172,802 | $1 | $172,801 |
| 2023 | $3,176 | $168,946 | $1 | $168,945 |
| 2022 | $2,849 | $135,215 | $1 | $135,214 |
| 2021 | $2,550 | $106,389 | $1 | $106,388 |
| 2020 | $2,431 | $103,556 | $1 | $103,555 |
| 2019 | $2,287 | $91,663 | $1 | $91,662 |
| 2018 | $1,972 | $76,061 | $0 | $0 |
| 2017 | $1,835 | $61,835 | $0 | $0 |
| 2016 | $1,837 | $61,210 | $0 | $0 |
| 2015 | $1,816 | $58,284 | $0 | $0 |
| 2014 | $1,646 | $57,357 | $0 | $0 |
C
Landlord's Agent in 2019
Cliff Glansen
FLATFLEE.COM INC
(877) 575-5505
4 in this area
2,753 Total Sales

Tenant's Agent in 2019
PAULA BUZETA
GREEN PALM REALTY & PROPERTY MANAGEMENT
(904) 240-2152
67 Total Sales
N
Buyer's Agent in 2018
NON MLS
NON MLS
9
Buyer's Agent in 2018
99999 99999
WATSON REALTY CORP
Seller's Agent in 2013
Kimberly Knapp
COLDWELL BANKER VANGUARD REALTY
(904) 334-7425
1 Total Sale
J
Buyer's Agent in 2013
JOSHUA DANLEY
BERKSHIRE HATHAWAY HOMESERVICES FLORIDA NETWORK REALTY
Source: realMLS (Northeast Florida Multiple Listing Service)
MLS Number: 1016110
APN: 04-05-26-014266-200-21
Disclaimer: Certain information contained herein is derived from information provided by parties other than Homes.com. All information provided is deemed reliable, but is not guaranteed to be accurate and should be independently verified.
![]() IDX information is provided exclusively for personal, non-commercial use, and may not be used for any purpose other than to identify prospective properties consumers may be interested in purchasing. Data is deemed reliable but is not guaranteed accurate by NEFMLS.
IDX information is provided exclusively for personal, non-commercial use, and may not be used for any purpose other than to identify prospective properties consumers may be interested in purchasing. Data is deemed reliable but is not guaranteed accurate by NEFMLS.