R
Landlord's Agent in 2021
ROGER PERKINS
PERKINS REALTY
(904) 278-7779
17 in this area
37 Total Sales


Estimated Value: $152,127 - $177,000
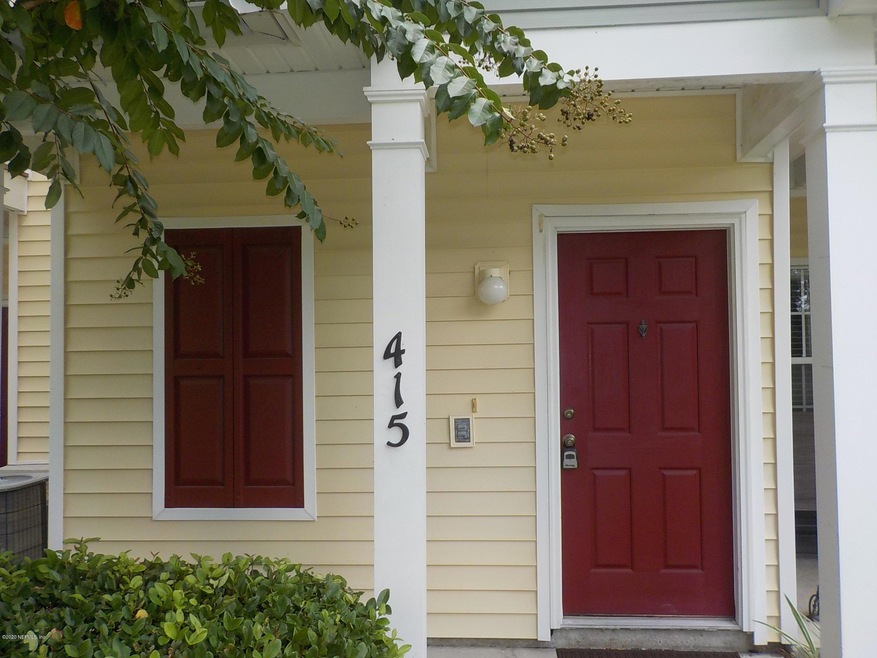
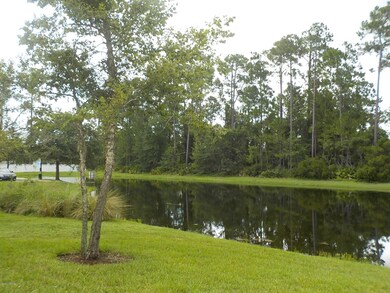
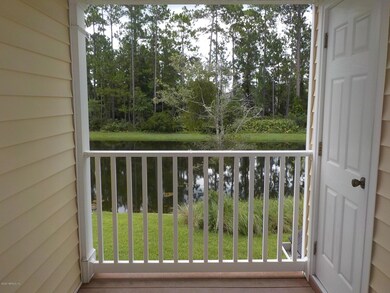
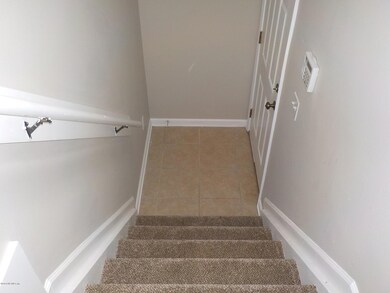
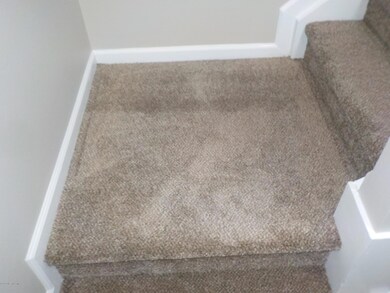
Beautiful 1BR, 1 bath upstairs condo in the heart of it all! Open floor plan, there are a TON of 42 inch cabinets, and stainless steel appliances. BRAND NEW Vinyl planking in the living areas and bedroom and BRAND NEW carpet on the stairs. Entire condo received a fresh coat of neutral colored paint. Tranquil water view from the upstairs balcony. All Fleming Island Plantation amenities are included. Enjoy all the fun and none of the work. A short distance to schools, shopping, restaurants, entertainment and more, plus a quick drive to NAS JAX. This unit includes a stackable washer & dryer.
| Date | Buyer | Sale Price | Title Company |
|---|---|---|---|
| Foxworthy Investments Llc | $45,000 | Americas Choice Title Co | |
| Baker Clifford Alexander | $80,000 | Commerce Title & Ins Co |
| Date | Status | Borrower | Loan Amount |
|---|---|---|---|
| Previous Owner | Baker Clifford Alexander | $79,990 |
| Date | Event | Price | List to Sale | Price per Sq Ft | Prior Sale |
|---|---|---|---|---|---|
| 12/17/2023 12/17/23 | Off Market | $1,200 | -- | -- | |
| 12/17/2023 12/17/23 | Off Market | $1,150 | -- | -- | |
| 12/17/2023 12/17/23 | Off Market | $950 | -- | -- | |
| 12/17/2023 12/17/23 | Off Market | $1,000 | -- | -- | |
| 12/17/2023 12/17/23 | Off Market | $925 | -- | -- | |
| 12/17/2023 12/17/23 | Off Market | $900 | -- | -- | |
| 12/17/2023 12/17/23 | Off Market | $900 | -- | -- | |
| 12/17/2023 12/17/23 | Off Market | $850 | -- | -- | |
| 12/17/2023 12/17/23 | Off Market | $850 | -- | -- | |
| 12/17/2023 12/17/23 | Off Market | $825 | -- | -- | |
| 12/17/2023 12/17/23 | Off Market | $45,000 | -- | -- | |
| 09/27/2021 09/27/21 | For Rent | $1,200 | 0.0% | -- | |
| 08/31/2021 08/31/21 | Rented | $1,200 | +4.3% | -- | |
| 08/01/2021 08/01/21 | Under Contract | -- | -- | -- | |
| 09/01/2020 09/01/20 | Rented | $1,150 | 0.0% | -- | |
| 08/19/2020 08/19/20 | Under Contract | -- | -- | -- | |
| 07/29/2020 07/29/20 | For Rent | $1,150 | +21.1% | -- | |
| 01/31/2020 01/31/20 | For Rent | $950 | 0.0% | -- | |
| 01/30/2020 01/30/20 | Under Contract | -- | -- | -- | |
| 01/30/2020 01/30/20 | Rented | $950 | -5.0% | -- | |
| 08/15/2019 08/15/19 | Rented | $1,000 | 0.0% | -- | |
| 07/24/2019 07/24/19 | Under Contract | -- | -- | -- | |
| 07/19/2019 07/19/19 | For Rent | $1,000 | +8.1% | -- | |
| 03/18/2019 03/18/19 | Rented | $925 | 0.0% | -- | |
| 03/18/2019 03/18/19 | Under Contract | -- | -- | -- | |
| 03/18/2019 03/18/19 | For Rent | $925 | +2.8% | -- | |
| 07/17/2017 07/17/17 | Rented | $900 | 0.0% | -- | |
| 07/17/2017 07/17/17 | Under Contract | -- | -- | -- | |
| 07/17/2017 07/17/17 | For Rent | $900 | 0.0% | -- | |
| 06/23/2016 06/23/16 | Rented | $900 | 0.0% | -- | |
| 06/23/2016 06/23/16 | Under Contract | -- | -- | -- | |
| 06/23/2016 06/23/16 | For Rent | $900 | +5.9% | -- | |
| 08/21/2015 08/21/15 | Rented | $850 | 0.0% | -- | |
| 07/29/2015 07/29/15 | Under Contract | -- | -- | -- | |
| 07/13/2015 07/13/15 | For Rent | $850 | 0.0% | -- | |
| 06/23/2014 06/23/14 | Rented | $850 | 0.0% | -- | |
| 06/18/2014 06/18/14 | Under Contract | -- | -- | -- | |
| 05/22/2014 05/22/14 | For Rent | $850 | +3.0% | -- | |
| 10/25/2013 10/25/13 | Rented | $825 | -2.9% | -- | |
| 10/25/2013 10/25/13 | Under Contract | -- | -- | -- | |
| 09/17/2013 09/17/13 | For Rent | $850 | 0.0% | -- | |
| 09/16/2013 09/16/13 | Sold | $45,000 | -13.5% | $51 / Sq Ft | View Prior Sale |
| 07/19/2013 07/19/13 | Pending | -- | -- | -- | |
| 07/15/2013 07/15/13 | For Sale | $52,000 | -- | $59 / Sq Ft |
| Year | Tax Paid | Tax Assessment Tax Assessment Total Assessment is a certain percentage of the fair market value that is determined by local assessors to be the total taxable value of land and additions on the property. | Land | Improvement |
|---|---|---|---|---|
| 2025 | $1,793 | $145,316 | $1 | $145,315 |
| 2024 | $2,846 | $141,153 | $1 | $141,152 |
| 2023 | $2,846 | $137,854 | $1 | $137,853 |
| 2022 | $2,566 | $109,863 | $1 | $109,862 |
| 2021 | $2,302 | $85,890 | $1 | $85,889 |
| 2020 | $2,198 | $83,465 | $1 | $83,464 |
| 2019 | $2,085 | $75,128 | $1 | $75,127 |
| 2018 | $1,827 | $65,045 | $0 | $0 |
| 2017 | $1,709 | $53,386 | $0 | $0 |
| 2016 | $1,711 | $52,874 | $0 | $0 |
| 2015 | $1,694 | $50,475 | $0 | $0 |
| 2014 | $1,556 | $49,716 | $0 | $0 |
R
Landlord's Agent in 2021
ROGER PERKINS
PERKINS REALTY
(904) 278-7779
17 in this area
37 Total Sales
M
Seller's Agent in 2013
MAXINE LEVY
DAVIDSON REALTY, INC.
T
Buyer's Agent in 2013
Thomas Keller
UNITED REAL ESTATE GALLERY
J
Buyer's Agent in 2013
JEFFREY PERKINS
PERKINS REALTY
Source: realMLS (Northeast Florida Multiple Listing Service)
MLS Number: 1133353
APN: 04-05-26-014266-200-63
Disclaimer: Certain information contained herein is derived from information provided by parties other than Homes.com. All information provided is deemed reliable, but is not guaranteed to be accurate and should be independently verified.
![]() IDX information is provided exclusively for personal, non-commercial use, and may not be used for any purpose other than to identify prospective properties consumers may be interested in purchasing. Data is deemed reliable but is not guaranteed accurate by NEFMLS.
IDX information is provided exclusively for personal, non-commercial use, and may not be used for any purpose other than to identify prospective properties consumers may be interested in purchasing. Data is deemed reliable but is not guaranteed accurate by NEFMLS.
