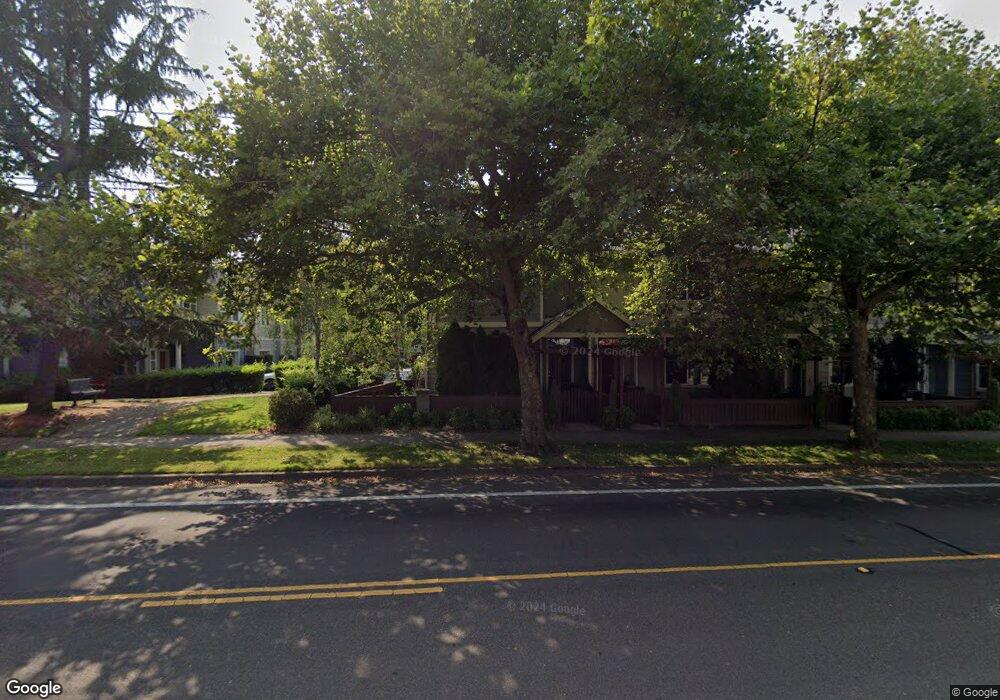
2200 NW Redelfs Way Unit 23 Beaverton, OR 97006
AmberGlen NeighborhoodEstimated Value: $400,232 - $443,000
3
Beds
3
Baths
1,483
Sq Ft
$283/Sq Ft
Est. Value
About This Home
This home is located at 2200 NW Redelfs Way Unit 23, Beaverton, OR 97006 and is currently estimated at $419,058, approximately $282 per square foot. 2200 NW Redelfs Way Unit 23 is a home located in Washington County with nearby schools including Lenox Elementary School, J.W. Poynter Middle School, and Liberty High School.
Ownership History
Date
Name
Owned For
Owner Type
Purchase Details
Closed on
Dec 26, 2019
Sold by
Udoyen Nsikan J
Bought by
Chin Samantha Leanne
Current Estimated Value
Home Financials for this Owner
Home Financials are based on the most recent Mortgage that was taken out on this home.
Original Mortgage
$256,000
Outstanding Balance
$225,214
Interest Rate
3.6%
Mortgage Type
New Conventional
Estimated Equity
$193,844
Purchase Details
Closed on
Jul 21, 2015
Sold by
Hovis Brian S
Bought by
Udoyen Nsikan J
Home Financials for this Owner
Home Financials are based on the most recent Mortgage that was taken out on this home.
Original Mortgage
$165,000
Interest Rate
4.01%
Mortgage Type
New Conventional
Purchase Details
Closed on
Dec 22, 2006
Sold by
Amberglen Village Townhomes Llc
Bought by
Hovis Brian S
Home Financials for this Owner
Home Financials are based on the most recent Mortgage that was taken out on this home.
Original Mortgage
$189,679
Interest Rate
4.75%
Mortgage Type
FHA
Create a Home Valuation Report for This Property
The Home Valuation Report is an in-depth analysis detailing your home's value as well as a comparison with similar homes in the area
Home Values in the Area
Average Home Value in this Area
Purchase History
| Date | Buyer | Sale Price | Title Company |
|---|---|---|---|
| Chin Samantha Leanne | $328,000 | First American | |
| Udoyen Nsikan J | $220,000 | First American | |
| Hovis Brian S | $193,179 | Fidelity Natl Title Co Of Or |
Source: Public Records
Mortgage History
| Date | Status | Borrower | Loan Amount |
|---|---|---|---|
| Open | Chin Samantha Leanne | $256,000 | |
| Previous Owner | Udoyen Nsikan J | $165,000 | |
| Previous Owner | Hovis Brian S | $189,679 |
Source: Public Records
Tax History Compared to Growth
Tax History
| Year | Tax Paid | Tax Assessment Tax Assessment Total Assessment is a certain percentage of the fair market value that is determined by local assessors to be the total taxable value of land and additions on the property. | Land | Improvement |
|---|---|---|---|---|
| 2026 | $3,754 | $236,540 | -- | -- |
| 2025 | $3,754 | $229,660 | -- | -- |
| 2024 | $3,647 | $222,980 | -- | -- |
| 2023 | $3,647 | $216,490 | $0 | $0 |
| 2022 | $3,548 | $216,490 | $0 | $0 |
| 2021 | $3,477 | $204,070 | $0 | $0 |
| 2020 | $3,402 | $198,130 | $0 | $0 |
| 2019 | $3,304 | $192,360 | $0 | $0 |
| 2018 | $3,163 | $186,760 | $0 | $0 |
| 2017 | $3,048 | $181,330 | $0 | $0 |
| 2016 | $2,965 | $176,050 | $0 | $0 |
| 2015 | $2,846 | $170,930 | $0 | $0 |
| 2014 | -- | $165,960 | $0 | $0 |
Source: Public Records
Map
Nearby Homes
- 2127 NE Cadbury Ave
- 2253 NE Sheffield Ave
- 8654 NE Rockspring St
- 8599 NE Hodes St
- 1195 NE 86th Way
- 1087 NE Perl Way
- 1845 NE 101st Ave Unit 201
- 1891 NE 101st Ave Unit 203
- 881 NE Wheelock Place
- 734 NE Adwick Dr
- 7959 NE Rockne Way
- 674 NE Newstead Ln
- 10105 NE Walker Rd
- 8100 NE Miriam Way
- 7915 NE Rockne Way
- 680 NE Adwick Dr Unit 5
- 7906 NE Miriam Way
- 7902 NE Miriam Way
- 670 NE Adwick Dr
- 654 NE Garswood Ln
- 2200 NW Redelfs Way
- 2200 NE Redelfs Way
- 2206 NW Redelfs Way
- 2212 NW Redelfs Way
- 2218 NW Redelfs Way
- 2218 NW Redelfs Way Unit 20
- 2184 NW Redelfs Way
- 2184 NW Redelfs Way Unit 24
- 2178 NW Redelfs Way
- 2178 NW Redelfs Way Unit Lot25
- 2166 NW Redelfs Way
- 2166 NW Redelfs Way Unit Lot26
- 2226 NW Redelfs Way
- 2226 NW Redelfs Way Unit 19
- 2151 NW Redelfs Way
- 2152 NW Redelfs Way
- 2152 NW Redelfs Way Unit 27
- 2232 NW Redelfs Way
- 2232 NW Redelfs Way Unit 18
- 2232 NE Redelfs Way