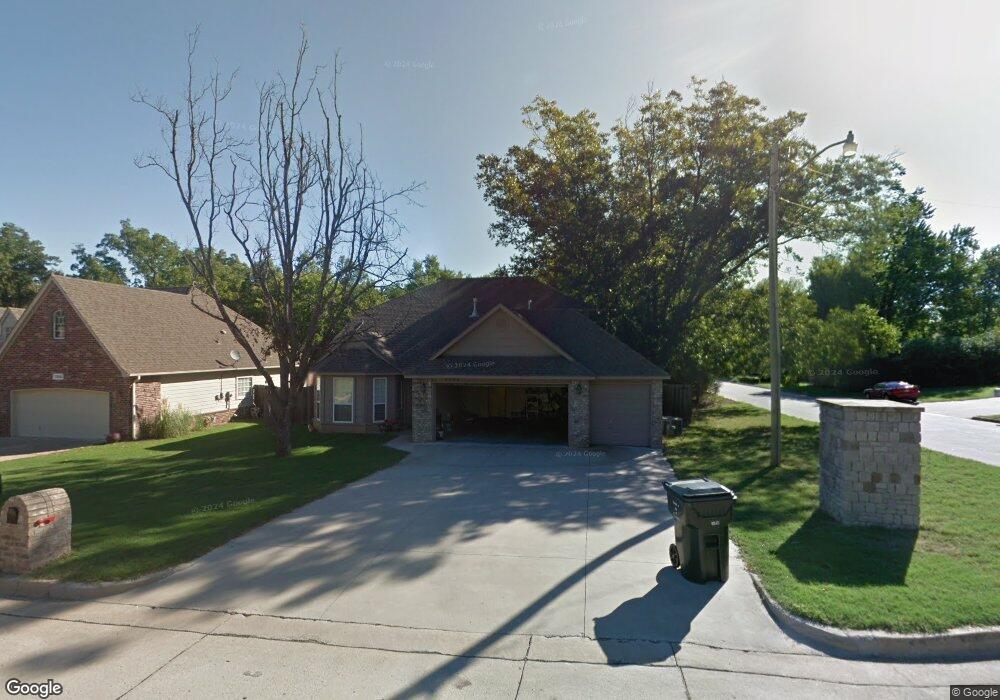
2200 Pecan Chase Cir Claremore, OK 74017
Estimated Value: $267,000 - $281,000
3
Beds
3
Baths
1,894
Sq Ft
$144/Sq Ft
Est. Value
About This Home
This home is located at 2200 Pecan Chase Cir, Claremore, OK 74017 and is currently estimated at $272,266, approximately $143 per square foot. 2200 Pecan Chase Cir is a home located in Rogers County with nearby schools including Westside Elementary School, Will Rogers Junior High School, and Claremore High School.
Ownership History
Date
Name
Owned For
Owner Type
Purchase Details
Closed on
Nov 12, 2019
Sold by
Skrmetta Michelle L and Skrmetta Peter
Bought by
Sherman Aaron and Sherman Samantha
Current Estimated Value
Home Financials for this Owner
Home Financials are based on the most recent Mortgage that was taken out on this home.
Original Mortgage
$178,703
Outstanding Balance
$156,553
Interest Rate
3.5%
Mortgage Type
FHA
Estimated Equity
$115,713
Purchase Details
Closed on
Nov 30, 2005
Sold by
Spray Helen R
Bought by
Spray Helen R and Chiders Michele R
Home Financials for this Owner
Home Financials are based on the most recent Mortgage that was taken out on this home.
Original Mortgage
$88,450
Interest Rate
5.69%
Mortgage Type
New Conventional
Purchase Details
Closed on
Oct 19, 2005
Sold by
Raven Hoime Inc
Bought by
Spray Helen R
Home Financials for this Owner
Home Financials are based on the most recent Mortgage that was taken out on this home.
Original Mortgage
$88,450
Interest Rate
5.69%
Mortgage Type
New Conventional
Create a Home Valuation Report for This Property
The Home Valuation Report is an in-depth analysis detailing your home's value as well as a comparison with similar homes in the area
Home Values in the Area
Average Home Value in this Area
Purchase History
| Date | Buyer | Sale Price | Title Company |
|---|---|---|---|
| Sherman Aaron | $182,000 | Century Title Of Oklahoma Lc | |
| Spray Helen R | -- | Firstitle And Abstract Servi | |
| Spray Helen R | $152,000 | First Title And Abstract Ser |
Source: Public Records
Mortgage History
| Date | Status | Borrower | Loan Amount |
|---|---|---|---|
| Open | Sherman Aaron | $178,703 | |
| Previous Owner | Spray Helen R | $88,450 |
Source: Public Records
Tax History Compared to Growth
Tax History
| Year | Tax Paid | Tax Assessment Tax Assessment Total Assessment is a certain percentage of the fair market value that is determined by local assessors to be the total taxable value of land and additions on the property. | Land | Improvement |
|---|---|---|---|---|
| 2025 | $2,042 | $23,093 | $3,061 | $20,032 |
| 2024 | $1,980 | $22,420 | $2,972 | $19,448 |
| 2023 | $1,980 | $21,767 | $2,750 | $19,017 |
| 2022 | $1,864 | $21,134 | $2,640 | $18,494 |
| 2021 | $1,723 | $20,518 | $2,640 | $17,878 |
| 2020 | $1,757 | $20,184 | $2,640 | $17,544 |
| 2019 | $1,707 | $18,425 | $2,640 | $15,785 |
| 2018 | $1,731 | $18,732 | $2,640 | $16,092 |
| 2017 | $1,706 | $18,576 | $2,640 | $15,936 |
| 2016 | $1,868 | $19,900 | $2,640 | $17,260 |
| 2015 | $1,786 | $19,265 | $2,640 | $16,625 |
| 2014 | $1,777 | $19,164 | $2,640 | $16,524 |
Source: Public Records
Map
Nearby Homes
- 2207 Pecan Chase Cir
- 2404 S Maywood Dr
- 602 Rosewood Ct
- 2412 S Maywood Dr
- 2701 Ridgeview Place
- 1420 W Haskell St
- 1230 W Dupont St
- 1410 W Danny St
- 1206 W Haskell St
- 751 Christmas Ln
- 205 N Kates Ave
- 2925 W Berwick
- 511 Glencoe Cir
- 208 N Chambers Trail
- 3011 W Berwick St
- 3103 Callaway Dr
- 2925 Holly Rd
- 2925 W Holly Hwy 20 Rd
- 3203 Callaway Dr
- 3112 Club St
- 2202 Pecan Chase Cir
- 2204 Pecan Chase Cir
- 2201 Pecan Chase Cir
- 2121 W Driftwood Dr
- 2121 W Driftwood Dr Unit A
- 2121 W Driftwood Dr Unit B
- 634 Earthside Dr
- 2206 Pecan Chase Cir
- 635 Earthside Dr
- 635 Earthside Dr Unit A & B
- 635 Earthside Dr Unit B
- 2203 Pecan Chase Cir
- 2009 W Driftwood Dr
- 636 Earthside Dr
- 2208 W Driftwood Dr
- 2205 Pecan Chase Cir
- 637 Earthside Dr
- 637 Earthside Dr Unit A & B
- 637 Earthside Dr Unit B
- 2209 Pecan Chase Cir