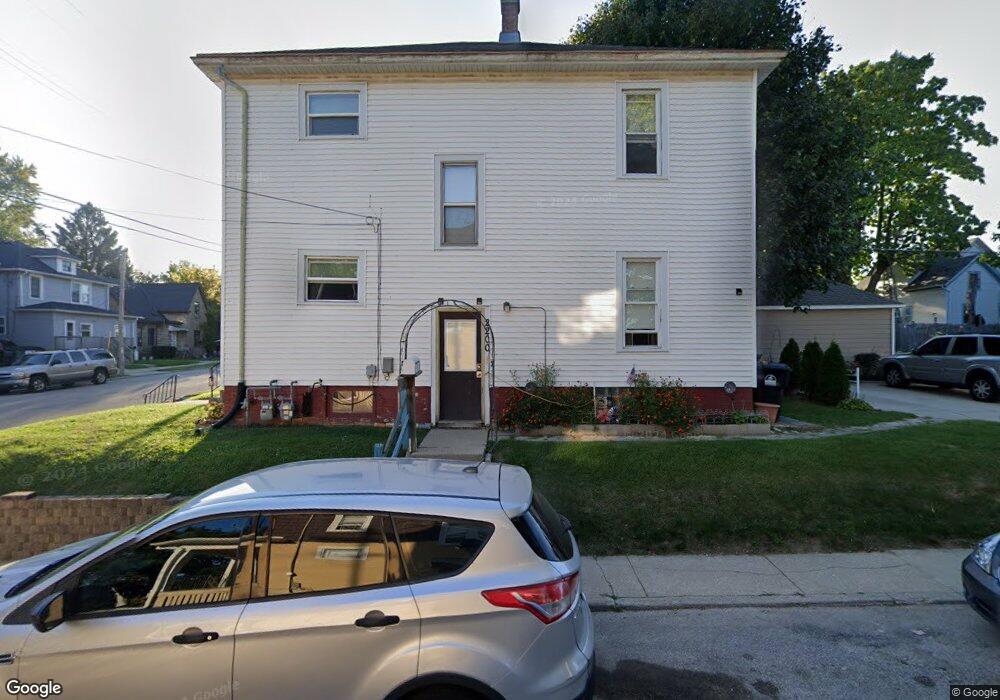
2200 Prospect St Racine, WI 53404
Prospect Heights NeighborhoodEstimated Value: $146,000 - $162,300
2
Beds
2
Baths
1,664
Sq Ft
$94/Sq Ft
Est. Value
About This Home
This home is located at 2200 Prospect St, Racine, WI 53404 and is currently estimated at $156,575, approximately $94 per square foot. 2200 Prospect St is a home located in Racine County with nearby schools including Wadewitz Elementary School, Jerstad-Agerholm Middle School, and Horlick High School.
Ownership History
Date
Name
Owned For
Owner Type
Purchase Details
Closed on
Oct 21, 2019
Sold by
Gonzalez Alojandra L
Bought by
Aj & Sons Properties Llc
Current Estimated Value
Purchase Details
Closed on
May 28, 2014
Sold by
Anderson Holding Unlimited Llc
Bought by
Anderson Holding Unlimited Llc
Purchase Details
Closed on
May 12, 2013
Sold by
Harambee Housing Project Inc
Bought by
Anderson Holdings Unlimited Llc
Purchase Details
Closed on
May 22, 2012
Sold by
Us Bank Na
Bought by
Harambee Housing Project Inc
Purchase Details
Closed on
Jan 12, 2012
Sold by
Vandenboom Michael A
Bought by
Us Bank N A and Sasco Mortgage Loan Trust
Purchase Details
Closed on
Jan 2, 2006
Sold by
Quesnell Patricia L
Bought by
Vandenboom Michael A
Home Financials for this Owner
Home Financials are based on the most recent Mortgage that was taken out on this home.
Original Mortgage
$89,910
Interest Rate
9.4%
Mortgage Type
Adjustable Rate Mortgage/ARM
Create a Home Valuation Report for This Property
The Home Valuation Report is an in-depth analysis detailing your home's value as well as a comparison with similar homes in the area
Home Values in the Area
Average Home Value in this Area
Purchase History
| Date | Buyer | Sale Price | Title Company |
|---|---|---|---|
| Aj & Sons Properties Llc | -- | None Available | |
| Anderson Holding Unlimited Llc | $21,000 | None Available | |
| Anderson Holdings Unlimited Llc | -- | 1St Service Title And Closin | |
| Harambee Housing Project Inc | $85,000 | None Available | |
| Us Bank N A | -- | None Available | |
| Vandenboom Michael A | $99,900 | -- |
Source: Public Records
Mortgage History
| Date | Status | Borrower | Loan Amount |
|---|---|---|---|
| Previous Owner | Vandenboom Michael A | $89,910 |
Source: Public Records
Tax History Compared to Growth
Tax History
| Year | Tax Paid | Tax Assessment Tax Assessment Total Assessment is a certain percentage of the fair market value that is determined by local assessors to be the total taxable value of land and additions on the property. | Land | Improvement |
|---|---|---|---|---|
| 2024 | $2,790 | $109,700 | $11,500 | $98,200 |
| 2023 | $2,663 | $100,000 | $11,500 | $88,500 |
| 2022 | $2,417 | $91,000 | $11,500 | $79,500 |
| 2021 | $2,775 | $83,000 | $11,500 | $71,500 |
| 2020 | $2,424 | $83,000 | $11,500 | $71,500 |
| 2019 | $2,230 | $77,000 | $11,500 | $65,500 |
| 2018 | $2,122 | $69,000 | $11,500 | $57,500 |
| 2017 | $2,200 | $69,000 | $11,500 | $57,500 |
| 2016 | $2,242 | $69,000 | $11,500 | $57,500 |
| 2015 | $3,385 | $69,000 | $11,500 | $57,500 |
| 2014 | $3,385 | $69,000 | $11,500 | $57,500 |
| 2013 | $3,385 | $69,000 | $14,300 | $54,700 |
Source: Public Records
Map
Nearby Homes
- 1105 Reschke Ave
- 1931 Harriet St
- 2415 Prospect St
- 1801 State St
- 206 Luedtke Ave
- 1301 Summit Ave
- 1309 Summit Ave
- 1322 Summit Ave
- 945 N Memorial Dr
- 1406 Blake Ave
- 207 Belmont Ave
- 423 Cliff Ave
- 2010 Kinzie Ave
- 1708 Shoop St
- 1129 Dr Martin Luther King Dr
- 1337 Kewaunee St
- 2105 Clarence Ave
- 2339 Carmel Ave
- 2400 Thor Ave
- 1320 Maple St
- 2206 Prospect St
- 1110 Lewis St
- 2116 Prospect St
- 2210 Prospect St
- 1109 Lewis St
- 1114 Lewis St
- 1109 Reschke Ave
- 2108 Prospect St
- 2201 Prospect St
- 2205 Prospect St
- 1120 Lewis St
- 2115 Prospect St
- 1117 Reschke Ave
- 2209 Prospect St
- 2222 Prospect St
- 1121 Lewis St
- 2106 Prospect St
- 2113 Prospect St
- 2213 Prospect St
- 1124 Lewis St