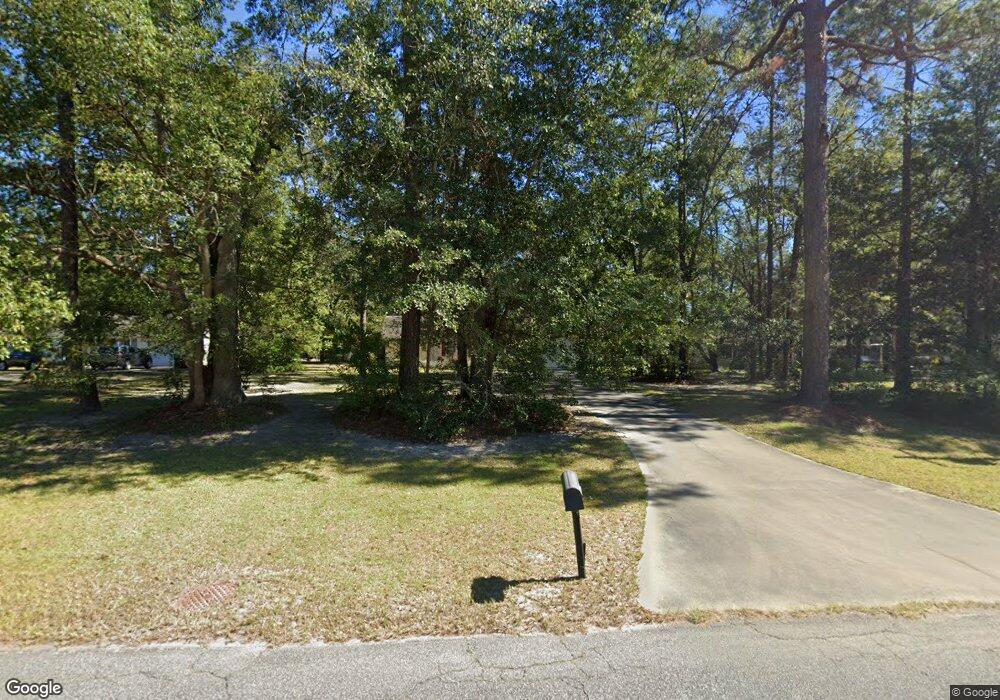
2200 Riverside Ave Waycross, GA 31501
Estimated Value: $189,000 - $200,000
3
Beds
2
Baths
1,401
Sq Ft
$138/Sq Ft
Est. Value
About This Home
This home is located at 2200 Riverside Ave, Waycross, GA 31501 and is currently estimated at $193,464, approximately $138 per square foot. 2200 Riverside Ave is a home located in Ware County with nearby schools including Center Elementary School, Waycross Middle School, and Ware County High School.
Ownership History
Date
Name
Owned For
Owner Type
Purchase Details
Closed on
Jun 10, 2011
Sold by
Hudson Jeffrey A
Bought by
Hudson Richard L
Current Estimated Value
Purchase Details
Closed on
Dec 30, 2010
Sold by
Hudson Richard L
Bought by
Hudson Jeffrey A
Purchase Details
Closed on
Mar 3, 2006
Sold by
Kemp Charity A
Bought by
Hudson Richard L
Home Financials for this Owner
Home Financials are based on the most recent Mortgage that was taken out on this home.
Original Mortgage
$65,000
Interest Rate
6.19%
Mortgage Type
New Conventional
Purchase Details
Closed on
Aug 7, 2001
Sold by
Mcmillan Charles J I
Bought by
Kemp Charity A
Purchase Details
Closed on
Dec 11, 1997
Sold by
Sasser John E
Bought by
Mcmillan Charles J I
Purchase Details
Closed on
Sep 9, 1997
Sold by
Thornton Conrad
Bought by
Sasser John E
Purchase Details
Closed on
Oct 21, 1996
Sold by
Thornton Thornton and Thornton Sasser
Bought by
Thornton Conrad
Create a Home Valuation Report for This Property
The Home Valuation Report is an in-depth analysis detailing your home's value as well as a comparison with similar homes in the area
Home Values in the Area
Average Home Value in this Area
Purchase History
| Date | Buyer | Sale Price | Title Company |
|---|---|---|---|
| Hudson Richard L | -- | -- | |
| Hudson Jeffrey A | -- | -- | |
| Hudson Richard L | $95,000 | -- | |
| Kemp Charity A | $86,000 | -- | |
| Mcmillan Charles J I | $74,900 | -- | |
| Sasser John E | $5,500 | -- | |
| Thornton Conrad | $2,400 | -- |
Source: Public Records
Mortgage History
| Date | Status | Borrower | Loan Amount |
|---|---|---|---|
| Previous Owner | Hudson Richard L | $65,000 |
Source: Public Records
Tax History Compared to Growth
Tax History
| Year | Tax Paid | Tax Assessment Tax Assessment Total Assessment is a certain percentage of the fair market value that is determined by local assessors to be the total taxable value of land and additions on the property. | Land | Improvement |
|---|---|---|---|---|
| 2024 | $2,510 | $65,682 | $6,100 | $59,582 |
| 2023 | $2,265 | $58,513 | $3,800 | $54,713 |
| 2022 | $2,332 | $58,513 | $3,800 | $54,713 |
| 2021 | $1,950 | $45,087 | $3,800 | $41,287 |
| 2020 | $1,908 | $43,773 | $3,800 | $39,973 |
| 2019 | $1,645 | $37,203 | $3,800 | $33,403 |
| 2018 | $1,602 | $35,889 | $3,800 | $32,089 |
| 2017 | $1,565 | $35,889 | $3,800 | $32,089 |
| 2016 | $1,565 | $35,889 | $3,800 | $32,089 |
| 2015 | $1,576 | $35,888 | $3,800 | $32,089 |
| 2014 | $1,574 | $35,889 | $3,800 | $32,089 |
| 2013 | -- | $35,888 | $3,800 | $32,088 |
Source: Public Records
Map
Nearby Homes
- 904 Golfview Dr
- 705 E Waring St
- 2784 Autumn Ridge Ln
- 1013 E Waring St
- 2123 Sunnyside Dr
- 515 Summit St
- 1408 Bethune St
- 2312 Spurgeon St
- 1301 Riverside Ave
- 2099 Ridge Rd
- 1410 Hazel St
- 607 Linden Dr
- 1407 Hazel St
- 2509 Tebeau St
- 0 Beville St
- 2120 Tebeau St
- 220 E Blackshear Ave
- 601 Community Dr
- 109 Hebard St
- 2202 Pioneer St
- 2218 Riverside Ave
- 2132 Riverside Ave
- 2116 Riverside Ave
- 2329 Prestige Dr
- 2321 Prestige Dr
- 2337 Prestige Dr
- 2301 Prestige Dr
- 816 E Waring St
- 2351 Riverside Ave
- 2322 Prestige Dr
- 2338 Prestige Dr
- 2306 Prestige Dr
- 820 E Waring St
- 832 Northwoods Dr
- 0 E Waring St
- E E Waring St
- 844 E Waring St
- 855 Northwoods Dr
- 2109 Darling Ave
- 855 Northwoods Dr