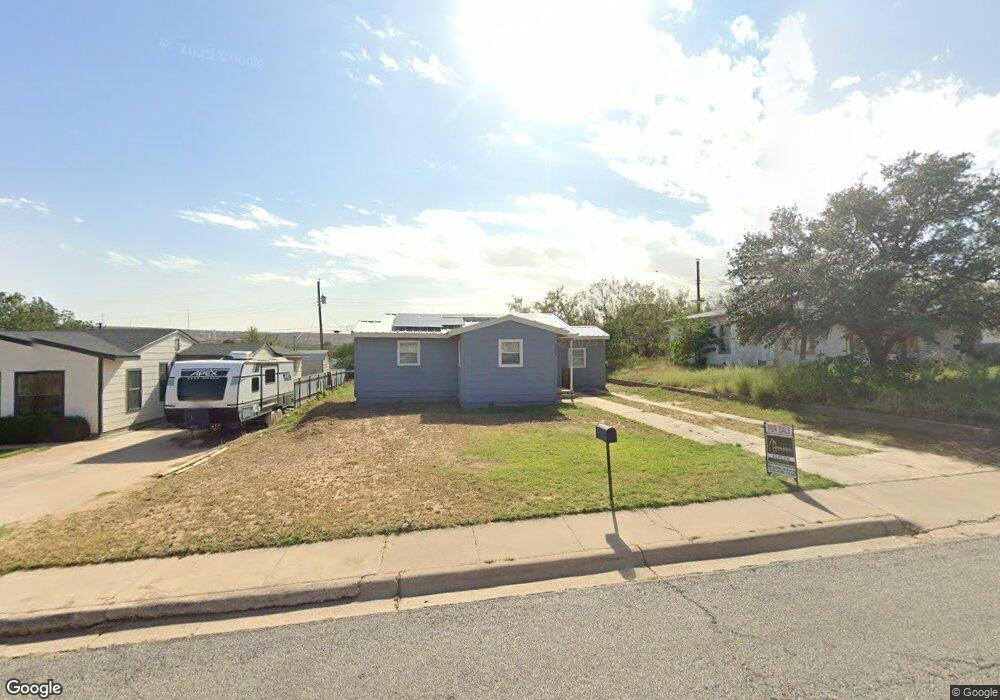
2200 S Monticello St Big Spring, TX 79720
Estimated Value: $121,247 - $142,000
3
Beds
1
Bath
1,148
Sq Ft
$114/Sq Ft
Est. Value
About This Home
This home is located at 2200 S Monticello St, Big Spring, TX 79720 and is currently estimated at $130,562, approximately $113 per square foot. 2200 S Monticello St is a home located in Howard County with nearby schools including Big Spring High School.
Ownership History
Date
Name
Owned For
Owner Type
Purchase Details
Closed on
Dec 19, 2024
Sold by
Smith Kaleb and Smith Eneida
Bought by
Vera Christopher Bryant
Current Estimated Value
Home Financials for this Owner
Home Financials are based on the most recent Mortgage that was taken out on this home.
Original Mortgage
$5,086
Interest Rate
6.79%
Mortgage Type
FHA
Purchase Details
Closed on
Sep 29, 2017
Sold by
Phillips Jared and Phillips Billy Jared
Bought by
Smith Kaleb and Smith Eneida
Home Financials for this Owner
Home Financials are based on the most recent Mortgage that was taken out on this home.
Original Mortgage
$85,914
Interest Rate
4.25%
Mortgage Type
FHA
Purchase Details
Closed on
Jun 10, 2009
Sold by
Seal Michael L
Bought by
Phillips Jared
Purchase Details
Closed on
Mar 3, 2004
Sold by
Leos Emma
Bought by
Seal Michael L
Create a Home Valuation Report for This Property
The Home Valuation Report is an in-depth analysis detailing your home's value as well as a comparison with similar homes in the area
Home Values in the Area
Average Home Value in this Area
Purchase History
| Date | Buyer | Sale Price | Title Company |
|---|---|---|---|
| Vera Christopher Bryant | -- | Surety Title | |
| Vera Christopher Bryant | -- | Surety Title | |
| Smith Kaleb | -- | Surety Titte Company | |
| Phillips Jared | -- | None Available | |
| Seal Michael L | $24,756 | None Available |
Source: Public Records
Mortgage History
| Date | Status | Borrower | Loan Amount |
|---|---|---|---|
| Closed | Vera Christopher Bryant | $5,086 | |
| Open | Vera Christopher Bryant | $127,153 | |
| Closed | Vera Christopher Bryant | $127,153 | |
| Previous Owner | Smith Kaleb | $85,914 |
Source: Public Records
Tax History Compared to Growth
Tax History
| Year | Tax Paid | Tax Assessment Tax Assessment Total Assessment is a certain percentage of the fair market value that is determined by local assessors to be the total taxable value of land and additions on the property. | Land | Improvement |
|---|---|---|---|---|
| 2024 | $1,558 | $114,296 | $6,462 | $107,834 |
| 2023 | $1,403 | $98,274 | $5,040 | $93,234 |
| 2022 | $1,477 | $72,343 | $4,200 | $68,143 |
| 2021 | $1,620 | $93,650 | $4,200 | $89,450 |
| 2020 | $1,490 | $62,653 | $4,200 | $58,453 |
| 2019 | $1,520 | $60,089 | $4,200 | $55,889 |
| 2018 | $1,826 | $60,936 | $4,200 | $56,736 |
| 2017 | $1,199 | $40,729 | $4,200 | $36,529 |
| 2016 | $840 | $28,551 | $4,200 | $24,351 |
| 2015 | -- | $29,314 | $4,200 | $25,114 |
| 2014 | -- | $18,052 | $1,200 | $16,852 |
Source: Public Records
Map
Nearby Homes
- 1210 Marijo Ave
- 1404 Marijo Ave
- 1309 Marijo Ave
- 1108 Stanford Ave
- 1302 Barnes Ave
- 2402 S Monticello St
- 2004 N Monticello St
- 1908 Morrison Dr
- 1200 Michael Ave
- Lot 31 Miami Cove
- Lot 25 Miami Cove
- 1104 S Monticello St
- 1710 Alabama St
- 1314 Birdwell Ln
- 3206 Drexel Ave
- 717 Tulane Ave
- 3207 Drexel Ave
- 2308 Brent Dr
- 1507 E 11th Place
- 1722 Yale Ave
- 2202 S Monticello St
- 2106 S Monticello St
- 2204 S Monticello St
- 2104 S Monticello St
- 2105 Morrison Dr
- 2107 Morrison Dr
- 1311 Lamar Ave
- 2103 Morrison Dr
- 2201 Morrison Dr
- 2206 S Monticello St
- 2102 S Monticello St
- 1309 Lamar Ave
- 1308 Lamar Ave
- 2203 Morrison Dr
- 2101 Morrison Dr
- 1402 Stanford Ave
- 1400 Stanford Ave
- 2100 S Monticello St
- 1307 Lamar Ave
- 2208 S Monticello St