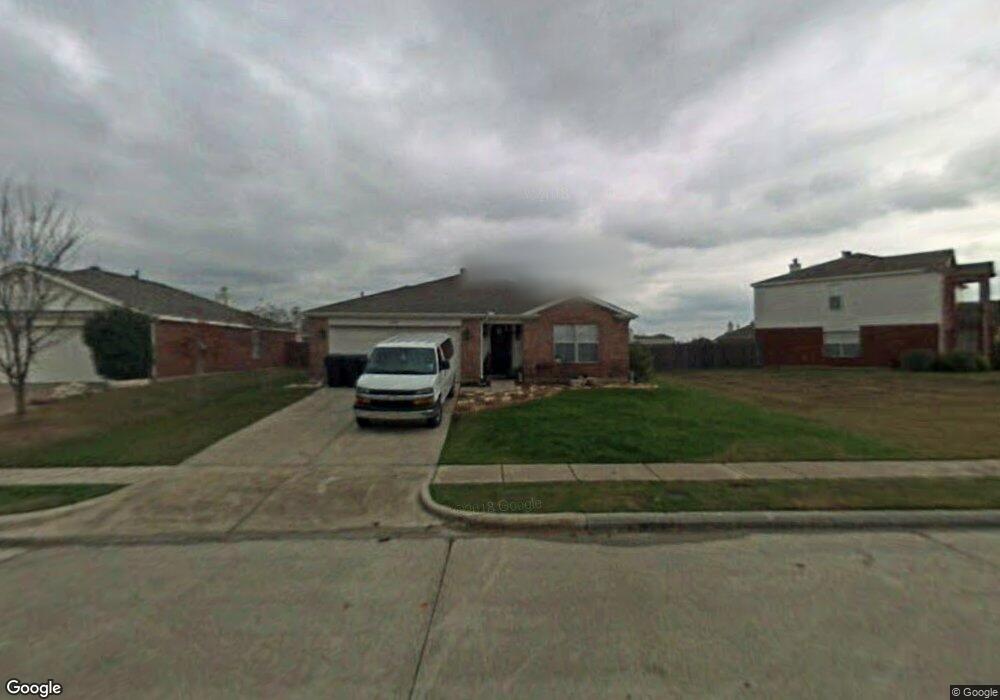
2200 Tisbury Way Little Elm, TX 75068
Estimated Value: $351,908 - $378,000
4
Beds
2
Baths
1,866
Sq Ft
$196/Sq Ft
Est. Value
About This Home
This home is located at 2200 Tisbury Way, Little Elm, TX 75068 and is currently estimated at $365,477, approximately $195 per square foot. 2200 Tisbury Way is a home located in Denton County with nearby schools including Corbell Elementary School, Robert Cobb Middle School, and Lone Star High School.
Ownership History
Date
Name
Owned For
Owner Type
Purchase Details
Closed on
Nov 29, 2018
Sold by
Ratcliff Frederick E and Ratcliff Portia A
Bought by
Wheatley Elizabeth Rose and Wheatley Warren Eugene
Current Estimated Value
Home Financials for this Owner
Home Financials are based on the most recent Mortgage that was taken out on this home.
Original Mortgage
$238,598
Outstanding Balance
$213,518
Interest Rate
5.62%
Mortgage Type
FHA
Estimated Equity
$151,959
Purchase Details
Closed on
Jul 27, 2000
Sold by
Pulte Homes Of Texas Lp
Bought by
Ratcliff Frederick E and Ratcliff Portia A
Home Financials for this Owner
Home Financials are based on the most recent Mortgage that was taken out on this home.
Original Mortgage
$131,605
Interest Rate
8.15%
Mortgage Type
FHA
Create a Home Valuation Report for This Property
The Home Valuation Report is an in-depth analysis detailing your home's value as well as a comparison with similar homes in the area
Home Values in the Area
Average Home Value in this Area
Purchase History
| Date | Buyer | Sale Price | Title Company |
|---|---|---|---|
| Wheatley Elizabeth Rose | -- | Republic Title Of Texas Inc | |
| Ratcliff Frederick E | -- | First American Title Co |
Source: Public Records
Mortgage History
| Date | Status | Borrower | Loan Amount |
|---|---|---|---|
| Open | Wheatley Elizabeth Rose | $238,598 | |
| Previous Owner | Ratcliff Frederick E | $131,605 |
Source: Public Records
Tax History Compared to Growth
Tax History
| Year | Tax Paid | Tax Assessment Tax Assessment Total Assessment is a certain percentage of the fair market value that is determined by local assessors to be the total taxable value of land and additions on the property. | Land | Improvement |
|---|---|---|---|---|
| 2025 | $4,677 | $350,061 | $77,049 | $277,176 |
| 2024 | $5,743 | $318,237 | $0 | $0 |
| 2023 | $4,190 | $289,306 | $77,049 | $310,378 |
| 2022 | $5,419 | $263,005 | $69,711 | $228,944 |
| 2021 | $5,224 | $239,095 | $45,863 | $193,232 |
| 2020 | $5,204 | $235,110 | $45,863 | $189,247 |
| 2019 | $5,467 | $236,102 | $45,863 | $190,239 |
| 2018 | $5,312 | $225,507 | $45,863 | $179,644 |
| 2017 | $5,070 | $213,911 | $45,863 | $168,048 |
| 2016 | $4,413 | $186,204 | $36,690 | $149,514 |
| 2015 | $3,288 | $161,913 | $27,884 | $134,029 |
| 2013 | -- | $132,991 | $27,884 | $105,107 |
Source: Public Records
Map
Nearby Homes
- 2312 Breanna Way
- 2108 Lake Fork Ln
- 2029 Falls Creek Dr
- 2308 Rigging Dr
- 1900 Clear Creek Dr
- 2601 Featherstone Dr
- 2444 Tisbury Way
- 2305 Sumac Ct
- 2212 Hamden Ct
- 2312 Chestnut Dr
- 2612 Nocona Way
- 2420 Chestnut Dr
- 2341 Leeward Place
- 2405 Chestnut Dr
- 2624 Deer Hollow Dr
- 2225 Olivia Ln
- 1898 Barton Springs Dr
- 1860 Barton Springs Dr
- 1905 Caddo St
- 2636 Deer Hollow Dr
- 2204 Tisbury Way
- 2300 Hampton Dr
- 2207 Breanna Way
- 2133 Breanna Way
- 2208 Tisbury Way
- 2304 Hampton Dr
- 2211 Breanna Way
- 2209 Tisbury Way
- 2213 Tisbury Way
- 2205 Tisbury Way
- 2212 Tisbury Way
- 2308 Hampton Dr
- 2129 Breanna Way
- 2217 Tisbury Way
- 2215 Breanna Way
- 2301 Hampton Dr
- 2221 Tisbury Way
- 2216 Tisbury Way
- 2312 Hampton Dr
- 2125 Breanna Way