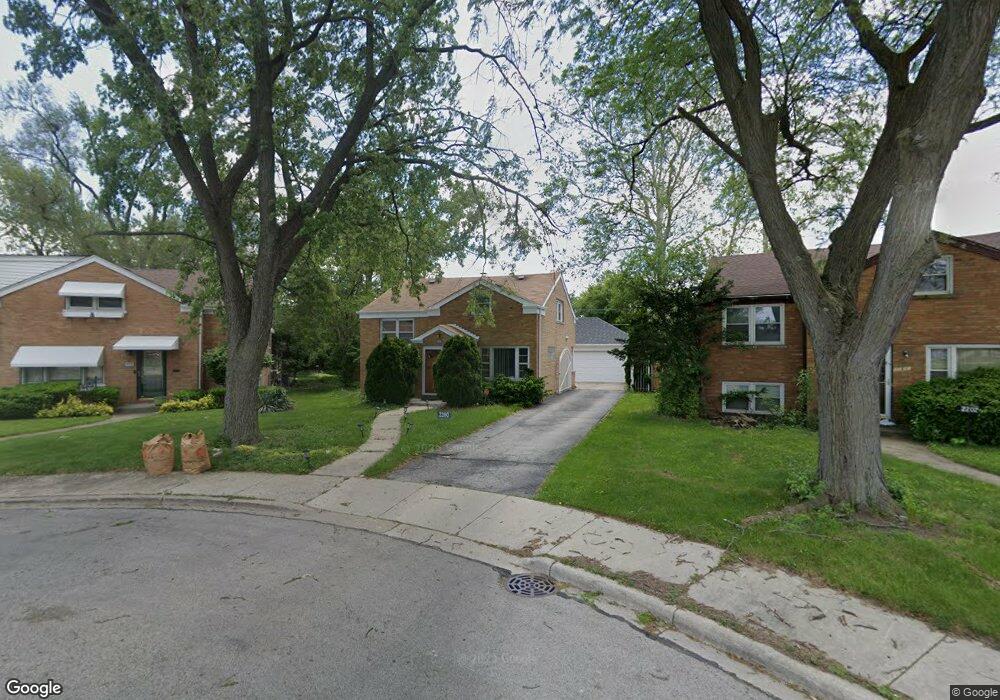
2200 Tyson Dr Broadview, IL 60155
Estimated Value: $238,000 - $279,888
2
Beds
1
Bath
898
Sq Ft
$291/Sq Ft
Est. Value
About This Home
This home is located at 2200 Tyson Dr, Broadview, IL 60155 and is currently estimated at $260,972, approximately $290 per square foot. 2200 Tyson Dr is a home located in Cook County with nearby schools including Lindop Elementary School and Proviso East High School.
Ownership History
Date
Name
Owned For
Owner Type
Purchase Details
Closed on
Nov 7, 2016
Sold by
Geevarghese Mathew and Geevarghese Aney M
Bought by
Mamgg Propertiesn Llc
Current Estimated Value
Purchase Details
Closed on
Jun 25, 2015
Sold by
Perryman Lafayette
Bought by
Geevarghese Mathew and Geevarghese Aney M
Purchase Details
Closed on
Jul 14, 2006
Sold by
Dixon David A and Rideau Jacqueline
Bought by
Perryman Lafayette
Home Financials for this Owner
Home Financials are based on the most recent Mortgage that was taken out on this home.
Original Mortgage
$148,000
Interest Rate
6.73%
Mortgage Type
Unknown
Purchase Details
Closed on
Jul 28, 1999
Sold by
Ogilvie Bradford P and Streitmatter Craig R
Bought by
Dixon David A and Rideau Jacqueline D
Home Financials for this Owner
Home Financials are based on the most recent Mortgage that was taken out on this home.
Original Mortgage
$145,500
Interest Rate
7.69%
Mortgage Type
FHA
Create a Home Valuation Report for This Property
The Home Valuation Report is an in-depth analysis detailing your home's value as well as a comparison with similar homes in the area
Home Values in the Area
Average Home Value in this Area
Purchase History
| Date | Buyer | Sale Price | Title Company |
|---|---|---|---|
| Mamgg Propertiesn Llc | -- | None Available | |
| Geevarghese Mathew | $75,000 | None Available | |
| Perryman Lafayette | $185,000 | Ticor Title | |
| Dixon David A | $146,500 | -- |
Source: Public Records
Mortgage History
| Date | Status | Borrower | Loan Amount |
|---|---|---|---|
| Previous Owner | Perryman Lafayette | $148,000 | |
| Previous Owner | Dixon David A | $145,500 |
Source: Public Records
Tax History Compared to Growth
Tax History
| Year | Tax Paid | Tax Assessment Tax Assessment Total Assessment is a certain percentage of the fair market value that is determined by local assessors to be the total taxable value of land and additions on the property. | Land | Improvement |
|---|---|---|---|---|
| 2024 | $6,694 | $20,001 | $4,004 | $15,997 |
| 2023 | $4,701 | $20,001 | $4,004 | $15,997 |
| 2022 | $4,701 | $14,757 | $2,912 | $11,845 |
| 2021 | $4,485 | $14,756 | $2,911 | $11,845 |
| 2020 | $4,438 | $14,756 | $2,911 | $11,845 |
| 2019 | $3,432 | $11,524 | $2,729 | $8,795 |
| 2018 | $3,433 | $11,524 | $2,729 | $8,795 |
| 2017 | $3,406 | $11,524 | $2,729 | $8,795 |
| 2016 | $3,663 | $10,854 | $2,547 | $8,307 |
| 2015 | $3,565 | $10,854 | $2,547 | $8,307 |
| 2014 | $3,921 | $11,835 | $2,547 | $9,288 |
| 2013 | -- | $13,359 | $2,547 | $10,812 |
Source: Public Records
Map
Nearby Homes
- 2204 W 14th St
- 2440 S 20th Ave
- 2412 S 19th Ave
- 2237 S 22nd Ave
- 2510 S 17th Ave
- 2234 S 18th Ave
- 2235 S 18th Ave
- 1500 Bristol Ave
- 2003 S 24th Ave
- 2011 S 25th Ave
- 2432 S 13th Ave
- 1934 S 20th Ave
- 1113 Bristol Ave
- 2003 S 18th Ave
- 1926 S 19th Ave
- 1910 S 22nd Ave
- 2036 S 15th Ave
- 1911 S 22nd Ave
- 1540 Norfolk Ave
- 2010 S 16th Ave
- 2202 Tyson Dr
- 2437 S 22nd Ave
- 2433 S 22nd Ave
- 2204 Tyson Dr
- 2429 S 22nd Ave
- 2206 Tyson Dr
- 2425 S 22nd Ave
- 2440 S 21st Ave
- 2436 S 21st Ave
- 2208 Tyson Dr
- 2444 S 21st Ave
- 2201 Tyson Dr
- 2432 S 21st Ave
- 2421 S 22nd Ave
- 2428 S 21st Ave
- 2448 S 21st Ave
- 2210 Tyson Dr
- 2424 S 21st Ave
- 2205 Tyson Dr
- 2416 S 22nd Ave