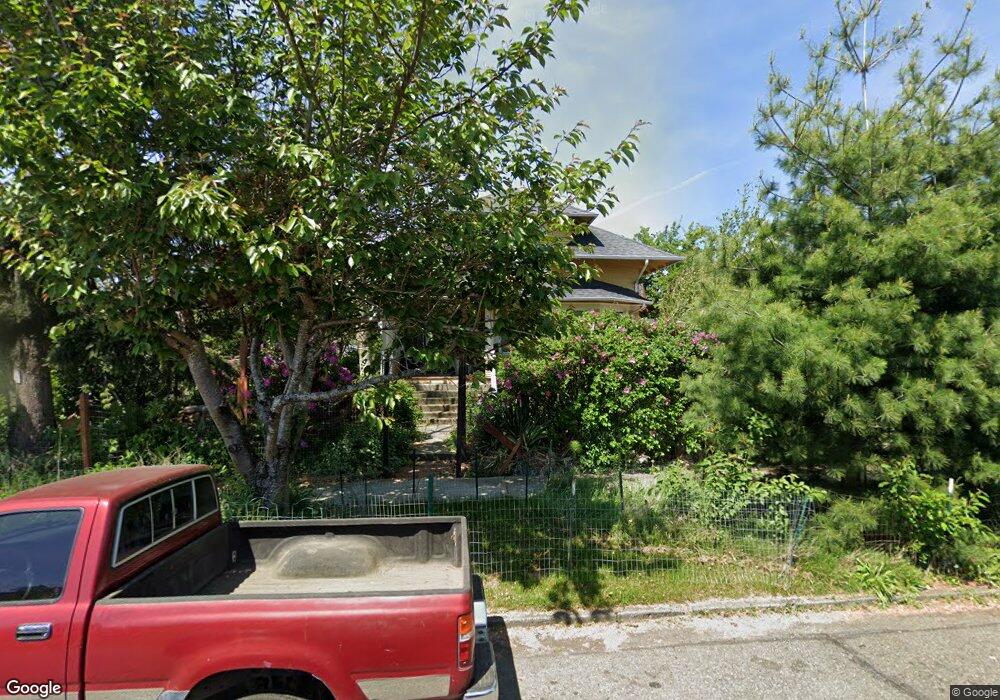
2201 A St Bellingham, WA 98225
Lettered Streets NeighborhoodEstimated Value: $708,000 - $776,352
3
Beds
2
Baths
2,160
Sq Ft
$341/Sq Ft
Est. Value
About This Home
This home is located at 2201 A St, Bellingham, WA 98225 and is currently estimated at $736,088, approximately $340 per square foot. 2201 A St is a home located in Whatcom County with nearby schools including Parkview Elementary School, Whatcom Middle School, and Bellingham High School.
Ownership History
Date
Name
Owned For
Owner Type
Purchase Details
Closed on
Feb 9, 2007
Sold by
Courchaine Timothy B
Bought by
Patera Katherine A and Courchaine Katherine A
Current Estimated Value
Purchase Details
Closed on
Nov 5, 2003
Sold by
Kingsland Graydon C
Bought by
Courchaine Timothy B and Courchaine Katherine A
Home Financials for this Owner
Home Financials are based on the most recent Mortgage that was taken out on this home.
Original Mortgage
$157,000
Interest Rate
5.89%
Mortgage Type
Purchase Money Mortgage
Purchase Details
Closed on
Oct 29, 1979
Sold by
Packer Lance V and Packer Gloria J
Bought by
Kingsland Graydon C and Plumley Patricia M
Create a Home Valuation Report for This Property
The Home Valuation Report is an in-depth analysis detailing your home's value as well as a comparison with similar homes in the area
Home Values in the Area
Average Home Value in this Area
Purchase History
| Date | Buyer | Sale Price | Title Company |
|---|---|---|---|
| Patera Katherine A | -- | None Available | |
| Courchaine Timothy B | $217,900 | First American Title Insuran | |
| Kingsland Graydon C | -- | First American Title Ins |
Source: Public Records
Mortgage History
| Date | Status | Borrower | Loan Amount |
|---|---|---|---|
| Previous Owner | Courchaine Timothy B | $157,000 | |
| Closed | Courchaine Timothy B | $39,000 |
Source: Public Records
Tax History
| Year | Tax Paid | Tax Assessment Tax Assessment Total Assessment is a certain percentage of the fair market value that is determined by local assessors to be the total taxable value of land and additions on the property. | Land | Improvement |
|---|---|---|---|---|
| 2025 | $2,484 | $797,988 | $269,552 | $528,436 |
| 2024 | $6,182 | $774,737 | $261,698 | $513,039 |
| 2023 | $6,182 | $794,415 | $268,345 | $526,070 |
| 2022 | $5,049 | $684,853 | $231,336 | $453,517 |
| 2021 | $4,953 | $543,534 | $183,600 | $359,934 |
| 2020 | $4,651 | $503,272 | $170,000 | $333,272 |
| 2019 | $4,164 | $456,795 | $146,406 | $310,389 |
| 2018 | $4,193 | $410,029 | $131,446 | $278,583 |
| 2017 | $3,619 | $353,023 | $113,168 | $239,855 |
| 2016 | $3,165 | $318,394 | $101,552 | $216,842 |
| 2015 | $3,104 | $289,949 | $92,752 | $197,197 |
| 2014 | -- | $275,094 | $88,000 | $187,094 |
| 2013 | -- | $236,000 | $73,500 | $162,500 |
Source: Public Records
Map
Nearby Homes
- 2011 Cornwall Ave
- 1112 Cornwall Ave
- 2216 Dean Ave
- 409 Kentucky St
- 2500 Cornwall Ave
- 1310 Ellsworth St
- 1310 G St
- 1200 W Holly St
- 605 Alabama St
- 1315 Astor St
- 1534 Franklin St
- 2414 Elm St
- 1310 Railroad Ave
- 911 Virginia St
- 2600 Elm St
- 508 Gladstone St
- 1524 Iron St
- 2313 Moore St
- 1126 N Forest St
- 1031 N State St Unit 107
Your Personal Tour Guide
Ask me questions while you tour the home.