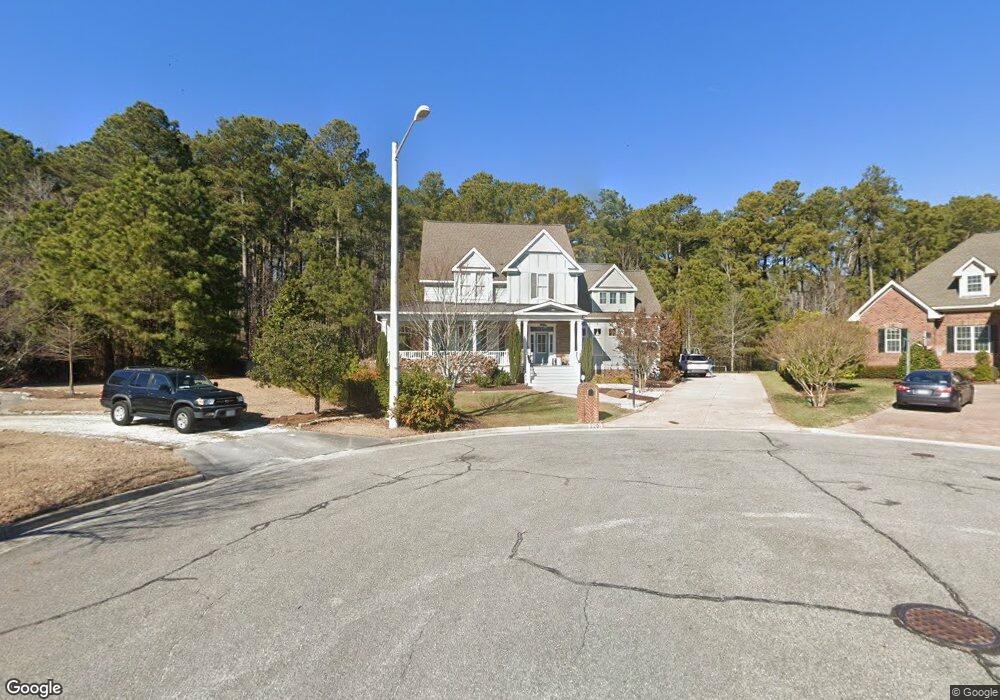
2201 Cancun Ct Virginia Beach, VA 23456
Virginia Beach Central NeighborhoodEstimated Value: $1,110,000 - $1,160,634
5
Beds
4
Baths
3,819
Sq Ft
$297/Sq Ft
Est. Value
About This Home
This home is located at 2201 Cancun Ct, Virginia Beach, VA 23456 and is currently estimated at $1,135,159, approximately $297 per square foot. 2201 Cancun Ct is a home located in Virginia Beach City with nearby schools including Red Mill Elementary School, Princess Anne Middle School, and Ocean Lakes High School.
Ownership History
Date
Name
Owned For
Owner Type
Purchase Details
Closed on
Jan 31, 2023
Sold by
Mccombs Alison Nicole
Bought by
Hoffmann Melissa S and Hoffmann Benjamin
Current Estimated Value
Home Financials for this Owner
Home Financials are based on the most recent Mortgage that was taken out on this home.
Original Mortgage
$861,900
Outstanding Balance
$834,563
Interest Rate
6.27%
Mortgage Type
VA
Estimated Equity
$300,596
Purchase Details
Closed on
Nov 6, 2018
Sold by
Huot Joshua J
Bought by
Mccombs Alison Nicole
Purchase Details
Closed on
Dec 20, 2013
Sold by
Stephen Alexander Homes Llc
Bought by
Huot Joshua J
Home Financials for this Owner
Home Financials are based on the most recent Mortgage that was taken out on this home.
Original Mortgage
$649,000
Interest Rate
4.35%
Mortgage Type
VA
Purchase Details
Closed on
Apr 11, 2013
Sold by
Lago Mar Assoc Llc
Bought by
Stephen Alexander Homes Llc
Create a Home Valuation Report for This Property
The Home Valuation Report is an in-depth analysis detailing your home's value as well as a comparison with similar homes in the area
Home Values in the Area
Average Home Value in this Area
Purchase History
| Date | Buyer | Sale Price | Title Company |
|---|---|---|---|
| Hoffmann Melissa S | $1,000,000 | Landmark Title | |
| Mccombs Alison Nicole | -- | None Available | |
| Huot Joshua J | $760,108 | -- | |
| Stephen Alexander Homes Llc | $250,000 | -- |
Source: Public Records
Mortgage History
| Date | Status | Borrower | Loan Amount |
|---|---|---|---|
| Open | Hoffmann Melissa S | $861,900 | |
| Previous Owner | Huot Joshua J | $649,000 |
Source: Public Records
Tax History Compared to Growth
Tax History
| Year | Tax Paid | Tax Assessment Tax Assessment Total Assessment is a certain percentage of the fair market value that is determined by local assessors to be the total taxable value of land and additions on the property. | Land | Improvement |
|---|---|---|---|---|
| 2025 | $8,664 | $1,025,300 | $350,000 | $675,300 |
| 2024 | $8,664 | $893,200 | $325,000 | $568,200 |
| 2023 | $8,054 | $813,500 | $300,000 | $513,500 |
| 2022 | $6,552 | $661,800 | $225,000 | $436,800 |
| 2021 | $6,245 | $630,800 | $194,000 | $436,800 |
| 2020 | $6,418 | $630,800 | $194,000 | $436,800 |
| 2019 | $6,042 | $573,800 | $174,000 | $399,800 |
| 2018 | $5,752 | $573,800 | $174,000 | $399,800 |
| 2017 | $5,572 | $555,800 | $156,000 | $399,800 |
| 2016 | $5,109 | $516,100 | $182,000 | $334,100 |
| 2015 | $5,603 | $566,000 | $182,000 | $384,000 |
| 2014 | $1,674 | $514,900 | $180,000 | $334,900 |
Source: Public Records
Map
Nearby Homes
- 905 Zia Ct
- 2205 Garita Ct
- 2325 Treesong Trail
- 2304 Treesong Trail
- 2337 Treesong Trail
- 2228 Zia Dr
- 2337 Santa fe Dr
- 1109 Cardston Ct
- 2400 Sabina Way
- 2100 Oaklawn Ct
- 948 Sandoval Dr
- 2664 Elson Green Ave
- 1113 Nipigon Ct
- 1000 San Jose Ct
- 1025 Purrington Ct
- 2153 Bierce Dr
- 2064 Schubert Dr
- 1093 Casanova Dr
- 2128 Teasdale Dr
- 2140 Teasdale Dr
- LOT254 Cancun Ct
- 2205 Cancun Ct
- 2200 Cancun Ct
- 2204 Cancun Ct
- 2209 Cancun Ct
- 2208 Cancun Ct
- 2205 Rio Rancho Dr
- 2209 Rio Rancho Dr
- 2213 Rio Rancho Dr
- 1016 Artesia Way
- 2217 Rio Rancho Dr
- 1009 Artesia Way
- 1020 Artesia Way
- 2208 Rio Rancho Dr
- 1017 Artesia Way
- 2212 Rio Rancho Dr
- LOT277 Rio Rancho Dr
- LOT280 Rio Rancho Dr
- LOT273 Rio Ranch Dr
- LOT307 Rio Rancho Dr