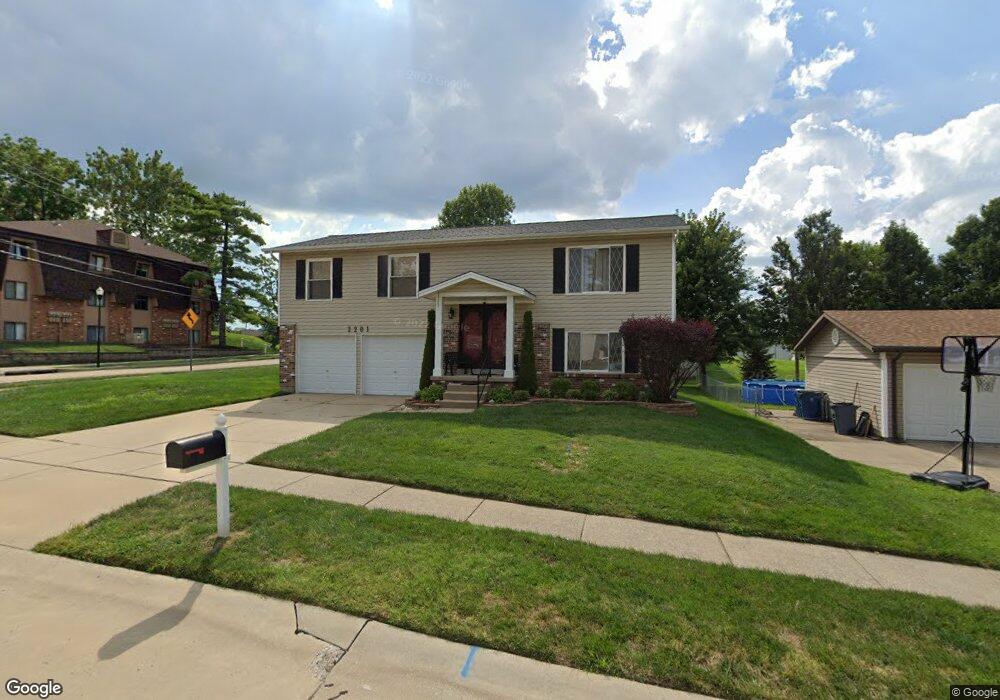
2201 Colony Meadows Ct Maryland Heights, MO 63043
Estimated Value: $256,683 - $291,000
3
Beds
2
Baths
1,032
Sq Ft
$267/Sq Ft
Est. Value
About This Home
This home is located at 2201 Colony Meadows Ct, Maryland Heights, MO 63043 and is currently estimated at $275,421, approximately $266 per square foot. 2201 Colony Meadows Ct is a home located in St. Louis County with nearby schools including McKelvey Elementary School, Parkway Northeast Middle School, and Parkway North High School.
Ownership History
Date
Name
Owned For
Owner Type
Purchase Details
Closed on
Mar 9, 2009
Sold by
Collins Evelyn J and Jones Evelyn J
Bought by
Jones Evelyn J
Current Estimated Value
Home Financials for this Owner
Home Financials are based on the most recent Mortgage that was taken out on this home.
Original Mortgage
$141,025
Interest Rate
5.06%
Mortgage Type
FHA
Purchase Details
Closed on
Aug 1, 2007
Sold by
Jones Evelyn J and Collins Evelyn J
Bought by
Collins Evelyn J
Home Financials for this Owner
Home Financials are based on the most recent Mortgage that was taken out on this home.
Original Mortgage
$32,300
Interest Rate
6.69%
Mortgage Type
Credit Line Revolving
Purchase Details
Closed on
Jan 22, 2007
Sold by
Jones Evelyn J and Collins Ernest
Bought by
Jones Evelyn J
Home Financials for this Owner
Home Financials are based on the most recent Mortgage that was taken out on this home.
Original Mortgage
$148,700
Interest Rate
6.11%
Mortgage Type
New Conventional
Purchase Details
Closed on
Dec 30, 2003
Sold by
Jones Dorothy
Bought by
Jones Evelyn J
Purchase Details
Closed on
Nov 10, 1997
Sold by
Qudell Jones
Bought by
Jones Dorothy
Create a Home Valuation Report for This Property
The Home Valuation Report is an in-depth analysis detailing your home's value as well as a comparison with similar homes in the area
Home Values in the Area
Average Home Value in this Area
Purchase History
| Date | Buyer | Sale Price | Title Company |
|---|---|---|---|
| Jones Evelyn J | -- | Sec | |
| Collins Evelyn J | -- | None Available | |
| Jones Evelyn J | -- | Reliable | |
| Jones Evelyn J | -- | -- | |
| Jones Dorothy | -- | -- |
Source: Public Records
Mortgage History
| Date | Status | Borrower | Loan Amount |
|---|---|---|---|
| Closed | Jones Evelyn J | $141,025 | |
| Closed | Collins Evelyn J | $32,300 | |
| Closed | Jones Evelyn J | $148,700 |
Source: Public Records
Tax History Compared to Growth
Tax History
| Year | Tax Paid | Tax Assessment Tax Assessment Total Assessment is a certain percentage of the fair market value that is determined by local assessors to be the total taxable value of land and additions on the property. | Land | Improvement |
|---|---|---|---|---|
| 2025 | $2,890 | $43,700 | $12,410 | $31,290 |
| 2024 | $2,890 | $40,300 | $10,340 | $29,960 |
| 2023 | $2,862 | $40,300 | $10,340 | $29,960 |
| 2022 | $2,819 | $36,280 | $10,340 | $25,940 |
| 2021 | $2,846 | $36,280 | $10,340 | $25,940 |
| 2020 | $2,518 | $32,340 | $13,930 | $18,410 |
| 2019 | $2,487 | $32,340 | $13,930 | $18,410 |
| 2018 | $2,316 | $27,720 | $8,970 | $18,750 |
| 2017 | $2,290 | $27,720 | $8,970 | $18,750 |
| 2016 | $2,241 | $25,840 | $6,900 | $18,940 |
| 2015 | $2,339 | $25,840 | $6,900 | $18,940 |
| 2014 | $1,874 | $22,550 | $4,520 | $18,030 |
Source: Public Records
Map
Nearby Homes
- 11833 McKelvey Gardens Dr
- 2229 Murray Forest Dr
- 11932 Ameling Rd
- 11916 Meadowpark Ct
- 2041 Falling Brook Dr
- 11846 Sologne Ct Unit 39B
- 2234 Arborview Dr
- 1759 Roth Hill Dr
- 12746 Saddlemaker Ct
- 1827 Pheasant Run Dr
- 2598 Bennington Place
- 1718 Pheasant Run Dr
- 20 Millwell Dr
- 167 Edgeworth Ave
- 12201 Dr
- 2427 Pheasant Run Dr
- 2213 Rule Ave
- 2755 Eldon Ave
- 2 Nottingham at Louiselle Park
- 2 Aspen II
- 2205 Colony Meadows Ct
- 2240 Bennington Place
- 2201 Mckelvey Rd
- 2209 Colony Meadows Ct
- 2208 Colony Meadows Ct
- 2213 Colony Meadows Ct
- 2203 Mckelvey Rd
- 2224 Colony Meadows Ct
- 11890 McKelvey Gardens Dr
- 2217 Colony Meadows Ct
- 11904 McKelvey Gardens Dr
- 2205 Mckelvey Rd
- 11908 McKelvey Gardens Dr
- 2228 Colony Meadows Ct
- 2221 Colony Meadows Ct
- 11912 McKelvey Gardens Dr
- 2229 Colony Meadows Ct
- 2225 Colony Meadows Ct
- 11878 McKelvey Gardens Dr
- 11916 McKelvey Gardens Dr