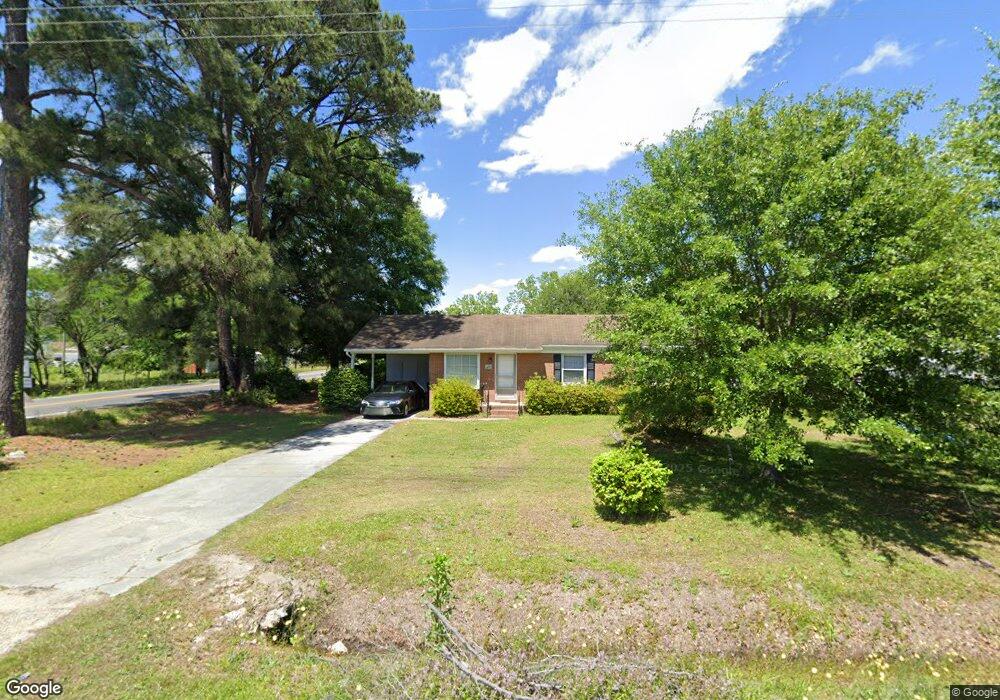
2201 E 7th St Lumberton, NC 28358
Estimated Value: $106,000 - $134,000
2
Beds
1
Bath
1,025
Sq Ft
$112/Sq Ft
Est. Value
About This Home
This home is located at 2201 E 7th St, Lumberton, NC 28358 and is currently estimated at $114,408, approximately $111 per square foot. 2201 E 7th St is a home with nearby schools including Rowland Norment Elementary School, Parkton Elementary School, and L. Gilbert Carroll Middle School.
Ownership History
Date
Name
Owned For
Owner Type
Purchase Details
Closed on
Apr 12, 2013
Sold by
Stark Martin and Stark Kimberly
Bought by
Martin & Martin Investmetns Llc
Current Estimated Value
Home Financials for this Owner
Home Financials are based on the most recent Mortgage that was taken out on this home.
Original Mortgage
$50,000
Outstanding Balance
$35,579
Interest Rate
3.65%
Mortgage Type
New Conventional
Estimated Equity
$78,829
Purchase Details
Closed on
Jan 16, 2007
Sold by
Little Stephen Jerry and Little Linda M
Bought by
Mcneill Laura M and Mcneill Grayson
Create a Home Valuation Report for This Property
The Home Valuation Report is an in-depth analysis detailing your home's value as well as a comparison with similar homes in the area
Purchase History
| Date | Buyer | Sale Price | Title Company |
|---|---|---|---|
| Martin & Martin Investmetns Llc | -- | None Available | |
| Mcneill Laura M | $75,000 | -- | |
| Mcneill Laura M | -- | -- |
Source: Public Records
Mortgage History
| Date | Status | Borrower | Loan Amount |
|---|---|---|---|
| Open | Martin & Martin Investmetns Llc | $50,000 |
Source: Public Records
Tax History
| Year | Tax Paid | Tax Assessment Tax Assessment Total Assessment is a certain percentage of the fair market value that is determined by local assessors to be the total taxable value of land and additions on the property. | Land | Improvement |
|---|---|---|---|---|
| 2025 | $883 | $91,800 | $11,400 | $80,400 |
| 2024 | $873 | $91,800 | $11,400 | $80,400 |
| 2023 | $680 | $68,300 | $10,400 | $57,900 |
| 2022 | $680 | $68,300 | $10,400 | $57,900 |
| 2021 | $666 | $68,300 | $10,400 | $57,900 |
| 2020 | $637 | $68,300 | $10,400 | $57,900 |
| 2018 | $650 | $53,600 | $10,400 | $53,600 |
| 2017 | $615 | $53,600 | $0 | $53,600 |
| 2016 | $615 | $53,600 | $0 | $53,600 |
| 2015 | $615 | $53,600 | $0 | $53,600 |
| 2014 | $615 | $53,600 | $0 | $53,600 |
Source: Public Records
Map
Nearby Homes
Your Personal Tour Guide
Ask me questions while you tour the home.