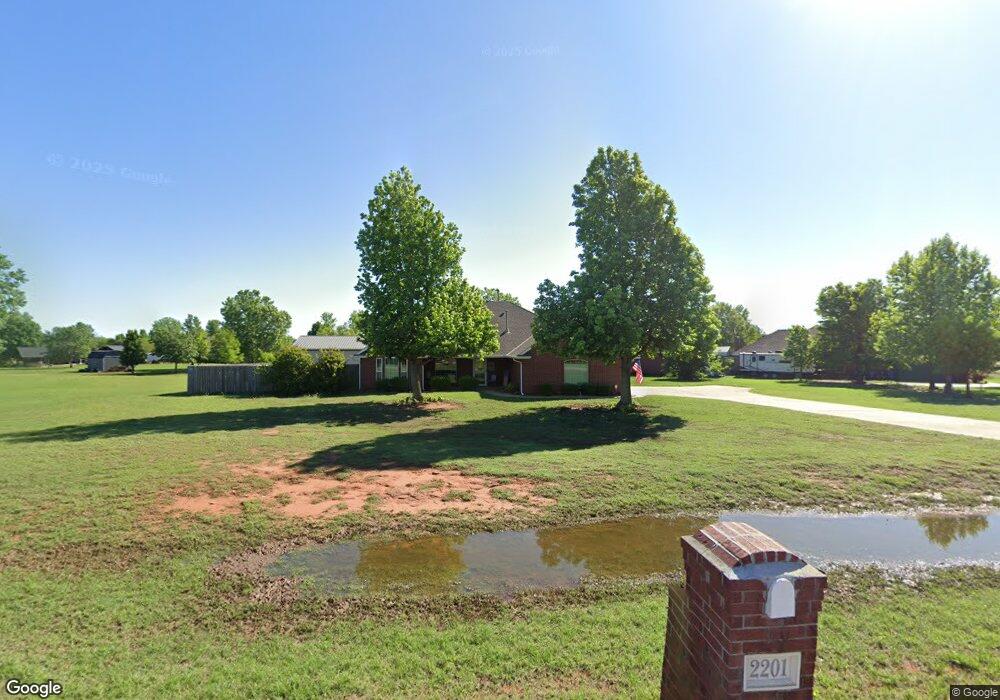
2201 E South Lake View Ln Mustang, OK 73064
Estimated Value: $304,000 - $343,000
3
Beds
2
Baths
1,868
Sq Ft
$173/Sq Ft
Est. Value
About This Home
This home is located at 2201 E South Lake View Ln, Mustang, OK 73064 and is currently estimated at $322,877, approximately $172 per square foot. 2201 E South Lake View Ln is a home located in Canadian County with nearby schools including Prairie View Elementary School, Canyon Ridge Intermediate School, and Mustang North Middle School.
Ownership History
Date
Name
Owned For
Owner Type
Purchase Details
Closed on
Feb 24, 2021
Sold by
Belleau Jenifer J
Bought by
Belleau Jenifer Joy and Jenifer Joy Belleau Revocable
Current Estimated Value
Purchase Details
Closed on
Jan 29, 2004
Sold by
Ezell Robert and Ezell Karen L
Bought by
Belleau David T and Belleau Jenifer J
Home Financials for this Owner
Home Financials are based on the most recent Mortgage that was taken out on this home.
Original Mortgage
$120,000
Interest Rate
5.79%
Purchase Details
Closed on
Aug 5, 2002
Sold by
Jefferson James M and Jefferson Nanette F
Purchase Details
Closed on
May 20, 1999
Sold by
M D Merryfield Inc
Purchase Details
Closed on
Sep 12, 1997
Sold by
Streeter Enterprises Inc
Create a Home Valuation Report for This Property
The Home Valuation Report is an in-depth analysis detailing your home's value as well as a comparison with similar homes in the area
Home Values in the Area
Average Home Value in this Area
Purchase History
| Date | Buyer | Sale Price | Title Company |
|---|---|---|---|
| Belleau Jenifer Joy | -- | None Available | |
| Jenifer Joy Belleau Revocable Trust | -- | None Listed On Document | |
| Belleau David T | $150,000 | -- | |
| -- | $150,000 | -- | |
| -- | $127,000 | -- | |
| -- | $18,000 | -- |
Source: Public Records
Mortgage History
| Date | Status | Borrower | Loan Amount |
|---|---|---|---|
| Previous Owner | Belleau David T | $120,000 |
Source: Public Records
Tax History Compared to Growth
Tax History
| Year | Tax Paid | Tax Assessment Tax Assessment Total Assessment is a certain percentage of the fair market value that is determined by local assessors to be the total taxable value of land and additions on the property. | Land | Improvement |
|---|---|---|---|---|
| 2024 | $2,445 | $26,274 | $2,700 | $23,574 |
| 2023 | $2,445 | $25,509 | $2,700 | $22,809 |
| 2022 | $2,400 | $24,766 | $2,700 | $22,066 |
| 2021 | $2,336 | $24,044 | $2,700 | $21,344 |
| 2020 | $2,279 | $23,344 | $2,700 | $20,644 |
| 2019 | $2,210 | $22,664 | $2,700 | $19,964 |
| 2018 | $2,189 | $22,004 | $2,700 | $19,304 |
| 2017 | $1,970 | $20,118 | $2,700 | $17,418 |
| 2016 | $1,913 | $20,118 | $2,700 | $17,418 |
| 2015 | -- | $18,963 | $2,700 | $16,263 |
| 2014 | -- | $18,411 | $2,700 | $15,711 |
Source: Public Records
Map
Nearby Homes
- 9225 SW 90th St
- 9217 SW 92nd St
- 2 S County Line Lot 2 Rd
- 1 S County Line Lot 1 Rd
- 1225 E Ruger Ln
- 1221 E Ruger Ln
- 1217 E Ruger Ln
- 1213 E Ruger Ln
- 1209 E Ruger Ln
- 1228 E Ruger Ln
- 7577 S Embassy Terrace
- 7569 S Embassy Terrace
- 8636 Ambassador Rd
- 1921 E Cottonwood Terrace
- 307 S Morgan Rd
- 531 S Monocoupe Ln
- 1712 E Cottonwood Terrace
- 2008 E Willow Creek Terrace
- 1885 E Sherwood Terrace
- 1738 E Frontier Terrace
- 2209 E South Lake View Ln
- 2108 E South Lake View Ln
- 2105 E South Lake View Ln
- 2100 E South Lake View Ln
- 1118 S Lake Ridge Ln
- 2108 E North Lake View Ln
- 2200 E North Lake View Ln
- 1309 S Lake Ridge Ln
- 2301 E South Lake View Ln
- 2204 E North Lake View Ln
- 1201 S Lake Ridge Ln
- 2208 E North Lake View Ln
- 2104 E North Lake View Ln
- 1117 S Lake Ridge Ln
- 2305 E South Lake View Ln
- 1109 S Lake Ridge Ln
- 2309 E South Lake View Ln
- 1101 S Lake Ridge Ln
- 2300 E North Lake View Ln
- 2313 E South Lake View Ln