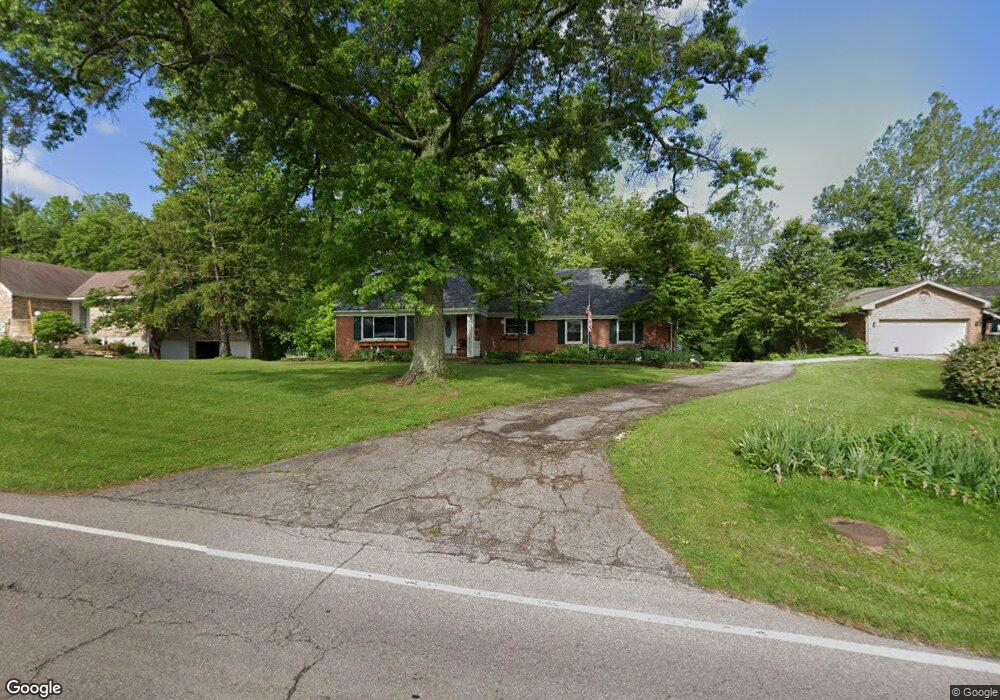
2201 Ebenezer Rd Cincinnati, OH 45233
Estimated Value: $263,000 - $351,000
3
Beds
3
Baths
1,539
Sq Ft
$189/Sq Ft
Est. Value
About This Home
This home is located at 2201 Ebenezer Rd, Cincinnati, OH 45233 and is currently estimated at $290,946, approximately $189 per square foot. 2201 Ebenezer Rd is a home located in Hamilton County with nearby schools including John Foster Dulles Elementary School, Rapid Run Middle School, and Oak Hills High School.
Ownership History
Date
Name
Owned For
Owner Type
Purchase Details
Closed on
Jun 28, 2001
Sold by
Feldhaus Daniel J and Feldhaus Catherine K
Bought by
Schrenk Steven J and Schrenk Veronica M
Current Estimated Value
Home Financials for this Owner
Home Financials are based on the most recent Mortgage that was taken out on this home.
Original Mortgage
$140,070
Interest Rate
7.27%
Mortgage Type
FHA
Purchase Details
Closed on
Dec 16, 1999
Sold by
Mcfarland Daniel P and Mcfarland Kathleen L
Bought by
Feldhaus Daniel J and Feldhaus Catherine K
Home Financials for this Owner
Home Financials are based on the most recent Mortgage that was taken out on this home.
Original Mortgage
$82,500
Interest Rate
7.87%
Create a Home Valuation Report for This Property
The Home Valuation Report is an in-depth analysis detailing your home's value as well as a comparison with similar homes in the area
Home Values in the Area
Average Home Value in this Area
Purchase History
| Date | Buyer | Sale Price | Title Company |
|---|---|---|---|
| Schrenk Steven J | $168,000 | First Title Agency Inc | |
| Feldhaus Daniel J | $167,500 | Title First Agency Inc |
Source: Public Records
Mortgage History
| Date | Status | Borrower | Loan Amount |
|---|---|---|---|
| Closed | Schrenk Steven J | $140,070 | |
| Closed | Feldhaus Daniel J | $82,500 |
Source: Public Records
Tax History
| Year | Tax Paid | Tax Assessment Tax Assessment Total Assessment is a certain percentage of the fair market value that is determined by local assessors to be the total taxable value of land and additions on the property. | Land | Improvement |
|---|---|---|---|---|
| 2025 | $3,621 | $69,482 | $16,814 | $52,668 |
| 2023 | $3,535 | $69,482 | $16,814 | $52,668 |
| 2022 | $2,956 | $49,221 | $15,064 | $34,157 |
| 2021 | $2,655 | $49,221 | $15,064 | $34,157 |
| 2020 | $2,689 | $49,221 | $15,064 | $34,157 |
| 2019 | $2,632 | $43,947 | $13,451 | $30,496 |
| 2018 | $2,636 | $43,947 | $13,451 | $30,496 |
| 2017 | $2,484 | $43,947 | $13,451 | $30,496 |
| 2016 | $2,227 | $39,316 | $12,317 | $26,999 |
| 2015 | $2,246 | $39,316 | $12,317 | $26,999 |
| 2014 | $2,249 | $39,316 | $12,317 | $26,999 |
| 2013 | $2,123 | $39,715 | $12,443 | $27,272 |
Source: Public Records
Map
Nearby Homes
- 2202 Ebenezer Rd
- 6090 Muddy Creek Rd
- 6040 Countrymeadow Ln
- 1711 Ebenezer Rd
- 1659 Devils Backbone Rd
- 2417 Quail Run Farm Ln
- 2659 Devils Backbone Rd
- 2239 Quail Run Farm Ln
- 5749 Beech Grove Ln
- 1287 Heather Ridge
- 1259 Wexford Ln
- 5949 Cleves Warsaw Pike
- 6009 Cleves Warsaw Pike
- 6233 Sharlene Dr
- 5690 Candlelite Terrace
- 3263 Bellacre Ct
- 5918 Leeside Trail
- 5671 Julmar Dr
- 5961 Lawrence Rd
- 3301 Cresentview Ln
- 2187 Ebenezer Rd
- 2235 Ebenezer Rd
- 2255 Ebenezer Rd
- 2240 Ebenezer Rd
- 2169 Ebenezer Rd
- 2184 Ebenezer Rd
- 2270 Ebenezer Rd
- 2193 Ebenezer Rd
- 2166 Ebenezer Rd
- 2137 Ebenezer Rd
- 2148 Ebenezer Rd
- 2191 Ebenezer Rd
- 2143 Ebenezer Rd
- 2300 Ebenezer Rd
- 2130 Ebenezer Rd
- 2331 Ebenezer Rd
- 2310 Ebenezer Rd
- 2247 Beechcroft Ct
- 2133 Ebenezer Rd
- 2229 Beechcroft Ct
Your Personal Tour Guide
Ask me questions while you tour the home.