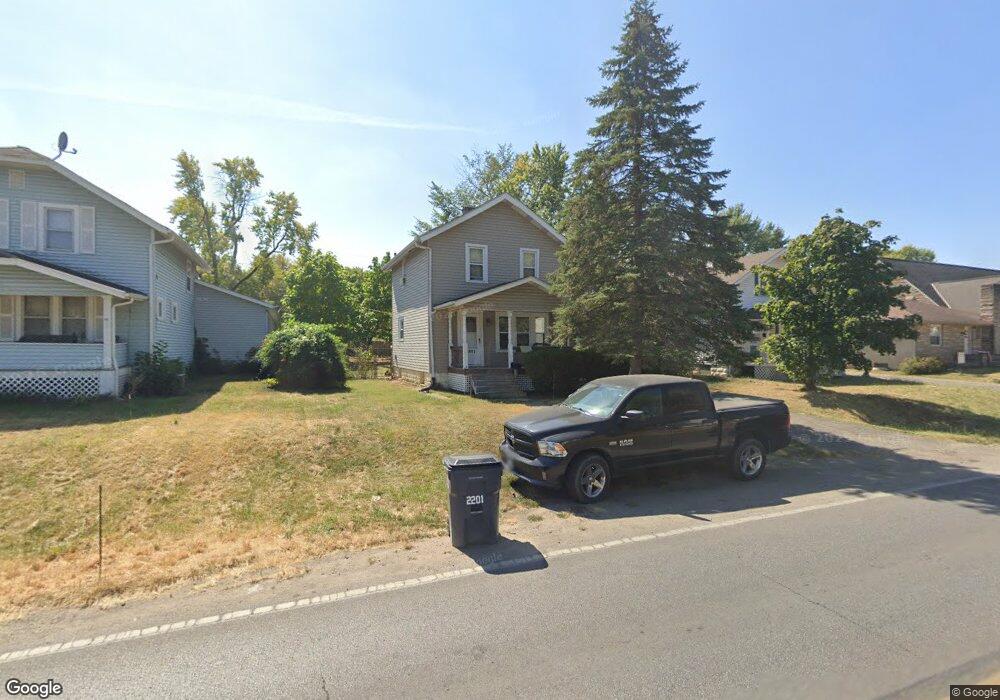
2201 Ferris Rd Columbus, OH 43224
North Linden NeighborhoodEstimated Value: $155,745 - $197,000
2
Beds
1
Bath
960
Sq Ft
$183/Sq Ft
Est. Value
About This Home
This home is located at 2201 Ferris Rd, Columbus, OH 43224 and is currently estimated at $175,936, approximately $183 per square foot. 2201 Ferris Rd is a home with nearby schools including North Linden Elementary School, Medina Middle School, and Mifflin High School.
Ownership History
Date
Name
Owned For
Owner Type
Purchase Details
Closed on
Dec 17, 2021
Sold by
Tedrow Donald R
Bought by
Tedrow Eric E
Current Estimated Value
Home Financials for this Owner
Home Financials are based on the most recent Mortgage that was taken out on this home.
Original Mortgage
$83,000
Outstanding Balance
$75,708
Interest Rate
3.11%
Mortgage Type
New Conventional
Estimated Equity
$100,228
Purchase Details
Closed on
Jun 9, 1987
Bought by
Tedrow Donald R
Create a Home Valuation Report for This Property
The Home Valuation Report is an in-depth analysis detailing your home's value as well as a comparison with similar homes in the area
Home Values in the Area
Average Home Value in this Area
Purchase History
| Date | Buyer | Sale Price | Title Company |
|---|---|---|---|
| Tedrow Eric E | $125,000 | Elite Land Title Agency | |
| Tedrow Donald R | -- | -- |
Source: Public Records
Mortgage History
| Date | Status | Borrower | Loan Amount |
|---|---|---|---|
| Open | Tedrow Eric E | $83,000 |
Source: Public Records
Tax History
| Year | Tax Paid | Tax Assessment Tax Assessment Total Assessment is a certain percentage of the fair market value that is determined by local assessors to be the total taxable value of land and additions on the property. | Land | Improvement |
|---|---|---|---|---|
| 2025 | $2,865 | $49,600 | $8,470 | $41,130 |
| 2024 | $2,865 | $49,600 | $8,470 | $41,130 |
| 2023 | $2,834 | $49,595 | $8,470 | $41,125 |
| 2022 | $1,800 | $24,720 | $5,150 | $19,570 |
| 2021 | $1,842 | $24,720 | $5,150 | $19,570 |
| 2020 | $1,845 | $24,720 | $5,150 | $19,570 |
| 2019 | $1,565 | $19,360 | $4,100 | $15,260 |
| 2018 | $1,482 | $19,360 | $4,100 | $15,260 |
| 2017 | $1,655 | $19,360 | $4,100 | $15,260 |
| 2016 | $1,651 | $17,260 | $3,330 | $13,930 |
| 2015 | $1,401 | $17,260 | $3,330 | $13,930 |
| 2014 | $1,353 | $17,260 | $3,330 | $13,930 |
| 2013 | $738 | $19,180 | $3,710 | $15,470 |
Source: Public Records
Map
Nearby Homes
- 2283 Ward Rd
- 2100 Ferris Rd
- 2045 Sale Rd
- 2081 Ormond Ave
- 2023 Ferris Rd
- 1997 Ferris Rd
- 4090 Cleveland Ave
- 2010 Melrose Ave
- 2529 Ferris Park Dr S
- 1874 Sale Rd
- 2547 Ferris Park Dr S
- 1863 Ward Rd
- 4309 Walford St
- 2583 Milverton Way
- 1734 Ferris Rd
- 3750 Dresden St
- 1637 Sale Rd
- 2594 Adda Ave
- 4057 Estates Place
- 2618 Clybourne Rd