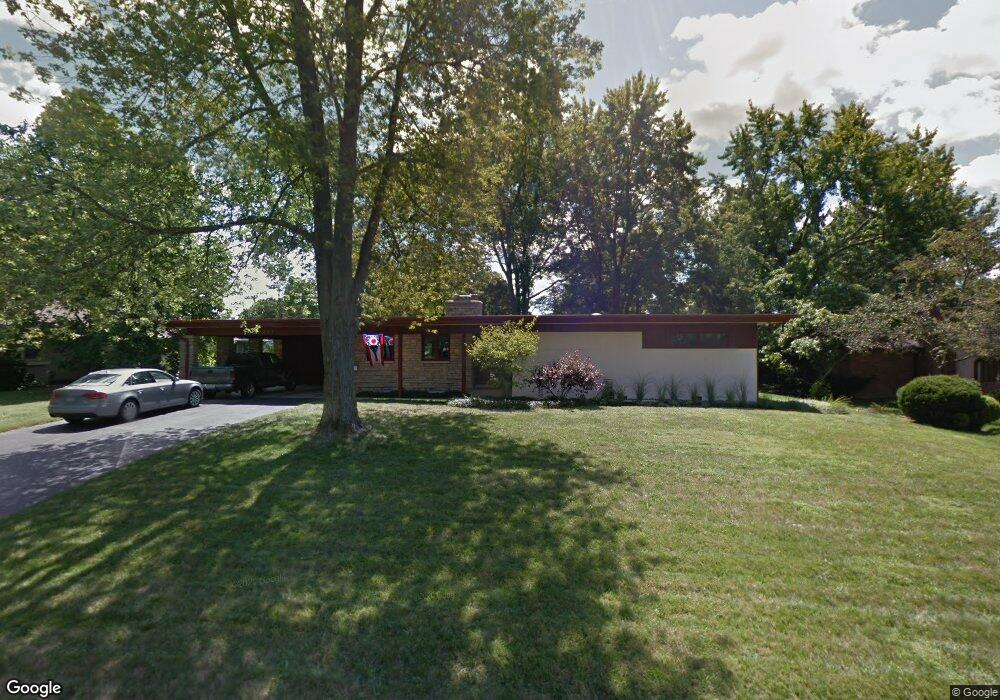
2201 Glenmere Rd Columbus, OH 43220
Estimated Value: $611,358 - $676,000
3
Beds
2
Baths
2,044
Sq Ft
$319/Sq Ft
Est. Value
About This Home
This home is located at 2201 Glenmere Rd, Columbus, OH 43220 and is currently estimated at $651,090, approximately $318 per square foot. 2201 Glenmere Rd is a home located in Franklin County with nearby schools including Windermere Elementary School, Hastings Middle School, and Upper Arlington High School.
Ownership History
Date
Name
Owned For
Owner Type
Purchase Details
Closed on
Jun 14, 2010
Sold by
Jimenez Roberto H and Jimenez Charleen M
Bought by
Boyer Richard T and Boyer Sara R
Current Estimated Value
Home Financials for this Owner
Home Financials are based on the most recent Mortgage that was taken out on this home.
Original Mortgage
$200,000
Outstanding Balance
$131,236
Interest Rate
4.86%
Mortgage Type
Purchase Money Mortgage
Estimated Equity
$519,854
Purchase Details
Closed on
Jun 19, 1995
Sold by
Est Garnet C Deweese
Bought by
Thomas S Milligan
Home Financials for this Owner
Home Financials are based on the most recent Mortgage that was taken out on this home.
Original Mortgage
$144,000
Interest Rate
8.27%
Mortgage Type
New Conventional
Purchase Details
Closed on
Oct 17, 1990
Create a Home Valuation Report for This Property
The Home Valuation Report is an in-depth analysis detailing your home's value as well as a comparison with similar homes in the area
Home Values in the Area
Average Home Value in this Area
Purchase History
| Date | Buyer | Sale Price | Title Company |
|---|---|---|---|
| Boyer Richard T | $295,000 | Title First | |
| Thomas S Milligan | $160,000 | -- | |
| -- | -- | -- |
Source: Public Records
Mortgage History
| Date | Status | Borrower | Loan Amount |
|---|---|---|---|
| Open | Boyer Richard T | $200,000 | |
| Closed | Thomas S Milligan | $144,000 |
Source: Public Records
Tax History
| Year | Tax Paid | Tax Assessment Tax Assessment Total Assessment is a certain percentage of the fair market value that is determined by local assessors to be the total taxable value of land and additions on the property. | Land | Improvement |
|---|---|---|---|---|
| 2025 | $9,935 | $171,610 | $81,520 | $90,090 |
| 2024 | $9,935 | $171,610 | $81,520 | $90,090 |
| 2023 | $9,812 | $171,605 | $81,515 | $90,090 |
| 2022 | $9,629 | $137,800 | $59,850 | $77,950 |
| 2021 | $8,524 | $137,800 | $59,850 | $77,950 |
| 2020 | $8,448 | $137,800 | $59,850 | $77,950 |
| 2019 | $7,294 | $105,180 | $59,850 | $45,330 |
| 2018 | $6,946 | $102,520 | $59,850 | $42,670 |
| 2017 | $6,942 | $102,520 | $59,850 | $42,670 |
| 2016 | $6,829 | $103,290 | $38,750 | $64,540 |
| 2015 | $6,823 | $103,290 | $38,750 | $64,540 |
| 2014 | $6,762 | $102,240 | $38,750 | $63,490 |
| 2013 | $3,228 | $92,925 | $35,210 | $57,715 |
Source: Public Records
Map
Nearby Homes
- 3900 Hillview Dr
- 2413 Edgevale Rd
- 2458 Edgevale Rd
- 3701 Reed Rd
- 2480 Shrewsbury Rd
- 2200 Nayland Rd
- 2257 Swansea Rd
- 2668 Edgevale Rd
- 2533 Middlesex Rd
- 2666 Woodstock Rd
- 2674 Woodstock Rd
- 3194 Mountview Rd
- 2227 Zollinger Rd
- 3134 Asbury Dr
- 1842 Ridgecliff Rd
- 3163 S Dorchester Rd
- 2729 Eastcleft Dr
- 1744 Ridgecliff Rd Unit 12
- 3175 Tremont Rd Unit 313
- 2026 Jervis Rd
- 2211 Glenmere Rd
- 2187 Glenmere Rd
- 2208 Shoreham Rd
- 3743 Woodbridge Rd
- 2196 Shoreham Rd
- 2220 Shoreham Rd
- 2221 Glenmere Rd
- 2175 Glenmere Rd
- 2220 Glenmere Rd
- 2184 Shoreham Rd
- 2230 Shoreham Rd
- 2170 Glenmere Rd
- 3753 Woodbridge Rd
- 2231 Glenmere Rd
- 2161 Glenmere Rd
- 2170 Shoreham Rd
- 3762 Walhaven Rd
- 2240 Shoreham Rd
- 3752 Woodbridge Rd
- 2205 Shoreham Rd
Your Personal Tour Guide
Ask me questions while you tour the home.