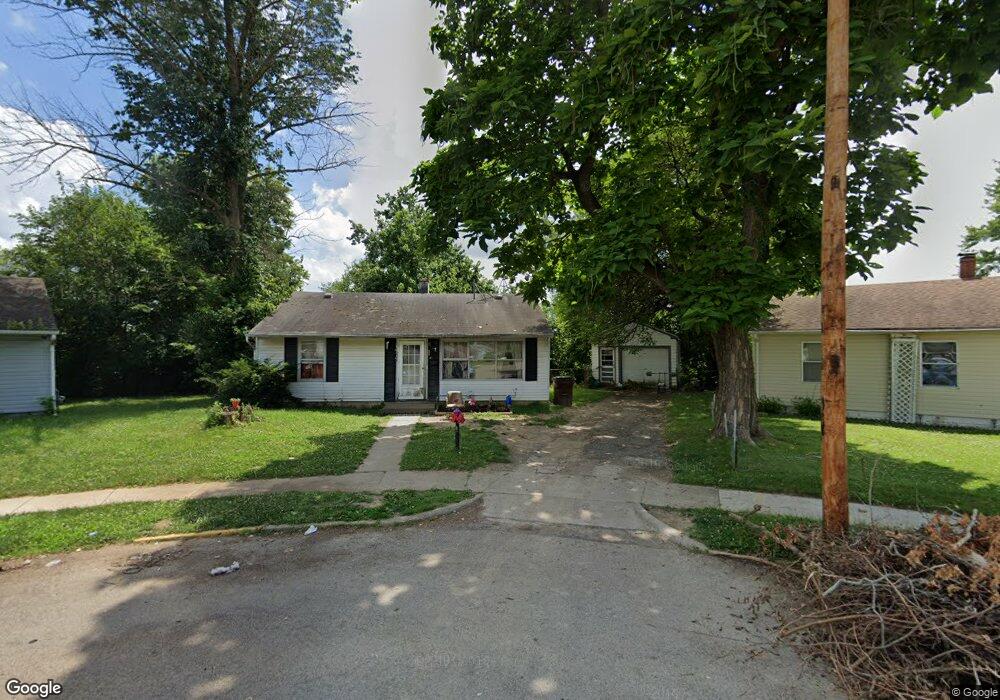
2201 Grant Ave Dayton, OH 45406
Fort McKinley NeighborhoodEstimated Value: $61,568 - $88,000
2
Beds
1
Bath
825
Sq Ft
$90/Sq Ft
Est. Value
About This Home
This home is located at 2201 Grant Ave, Dayton, OH 45406 and is currently estimated at $74,642, approximately $90 per square foot. 2201 Grant Ave is a home located in Montgomery County with nearby schools including Valerie Elementary School, Imagine Klepinger Road Community School, and North Dayton School of Science & Discovery.
Ownership History
Date
Name
Owned For
Owner Type
Purchase Details
Closed on
Mar 10, 2022
Sold by
Pope Family Trust and Pope Kevin
Bought by
Offringa Darrin and Offrinaga Jennifer
Current Estimated Value
Home Financials for this Owner
Home Financials are based on the most recent Mortgage that was taken out on this home.
Original Mortgage
$40,000
Outstanding Balance
$37,373
Interest Rate
3.92%
Mortgage Type
New Conventional
Estimated Equity
$37,269
Purchase Details
Closed on
Feb 2, 2021
Sold by
Pope Kevin
Bought by
Pope Kevin and Pope Tiffany
Purchase Details
Closed on
Aug 14, 2020
Sold by
J Bowers Holdings Llc
Bought by
Pope Kevin
Purchase Details
Closed on
Nov 22, 2010
Sold by
Estate Of Jeanne Anne Epperson
Bought by
Bowers Jean
Purchase Details
Closed on
Oct 1, 1993
Sold by
Adcock Linda Kay True
Bought by
Epperson Jeanne
Create a Home Valuation Report for This Property
The Home Valuation Report is an in-depth analysis detailing your home's value as well as a comparison with similar homes in the area
Home Values in the Area
Average Home Value in this Area
Purchase History
| Date | Buyer | Sale Price | Title Company |
|---|---|---|---|
| Offringa Darrin | -- | None Listed On Document | |
| Pope Kevin | -- | None Available | |
| Pope Kevin | $27,000 | None Available | |
| Bowers Jean | -- | None Available | |
| Epperson Jeanne | -- | -- | |
| Epperson Jeanne | -- | -- |
Source: Public Records
Mortgage History
| Date | Status | Borrower | Loan Amount |
|---|---|---|---|
| Open | Offringa Darrin | $40,000 |
Source: Public Records
Tax History Compared to Growth
Tax History
| Year | Tax Paid | Tax Assessment Tax Assessment Total Assessment is a certain percentage of the fair market value that is determined by local assessors to be the total taxable value of land and additions on the property. | Land | Improvement |
|---|---|---|---|---|
| 2024 | $857 | $11,080 | $3,640 | $7,440 |
| 2023 | $857 | $11,080 | $3,640 | $7,440 |
| 2022 | $895 | $8,520 | $2,800 | $5,720 |
| 2021 | $872 | $8,520 | $2,800 | $5,720 |
| 2020 | $889 | $8,520 | $2,800 | $5,720 |
| 2019 | $1,182 | $8,370 | $2,520 | $5,850 |
| 2018 | $1,170 | $8,370 | $2,520 | $5,850 |
| 2017 | $1,785 | $8,370 | $2,520 | $5,850 |
| 2016 | $1,297 | $9,220 | $2,800 | $6,420 |
| 2015 | $1,084 | $9,220 | $2,800 | $6,420 |
| 2014 | $1,084 | $9,220 | $2,800 | $6,420 |
| 2012 | -- | $8,580 | $3,500 | $5,080 |
Source: Public Records
Map
Nearby Homes
- 3748 Saint James Ave
- 2417 Wheeler Ave
- 2212 Chamberlin Ave
- 2620 N Gettysburg Ave
- 4445 Prescott Ave
- 3593 Saint James Ave
- 4541 Waymire Ave
- 2726 Wentworth Ave
- Lot#25 Glenbrook Dr
- Lot#1 Glenbrook Dr
- Lot#24 Glenbrook Dr
- Lot#21 Glenbrook Dr
- LOT#26 Glenbrook Dr
- 2145 Kipling Dr
- 4651 Christopher Ave
- 4725 W Hillcrest Ave
- Lot#14 Bridgeport Dr
- Lot#15 Bridgeport Dr
- 4621 Forsythe Ave
- 3801 Salem Ave
- 2207 Grant Ave
- 2200 Grant Ave
- 2211 Grant Ave
- 2206 Grant Ave
- 2212 Grant Ave
- 2217 Grant Ave
- 2412 N Gettysburg Ave
- 2218 Grant Ave
- 2209 Falmouth Ave
- 2221 Grant Ave
- 2213 Falmouth Ave
- 2205 Falmouth Ave
- 2217 Falmouth Ave
- 2201 Falmouth Ave
- 2222 Grant Ave
- 2221 Falmouth Ave
- 2235 Grant Ave
- 2225 Falmouth Ave
- 2228 Grant Ave
- 2197 Falmouth Ave