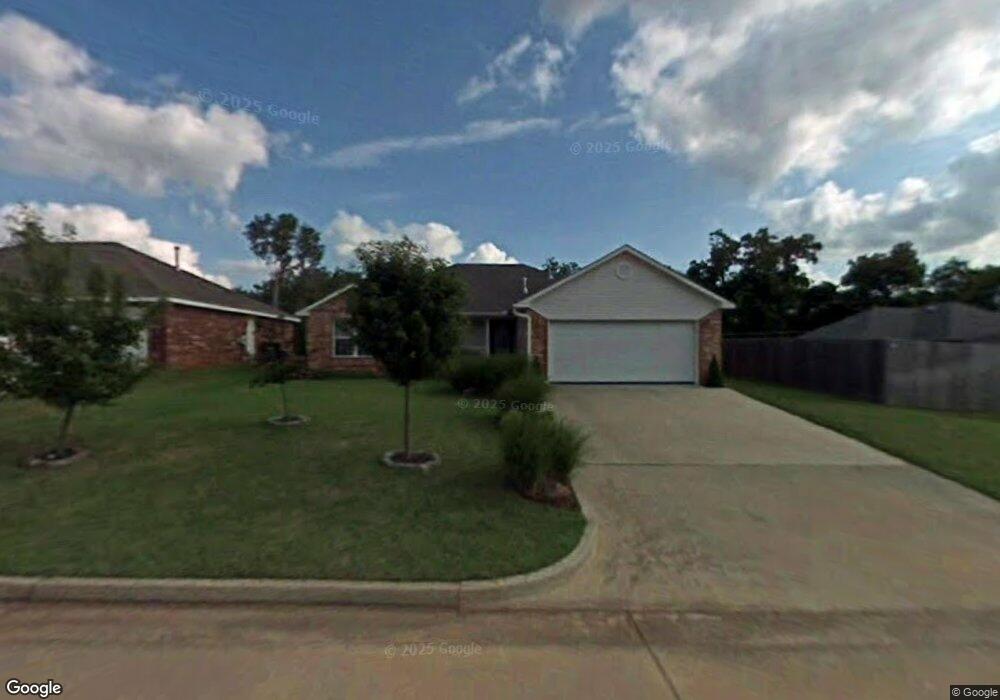
2201 Gray Dove Dr Shawnee, OK 74804
Estimated Value: $212,855 - $237,000
3
Beds
2
Baths
1,624
Sq Ft
$137/Sq Ft
Est. Value
About This Home
This home is located at 2201 Gray Dove Dr, Shawnee, OK 74804 and is currently estimated at $222,464, approximately $136 per square foot. 2201 Gray Dove Dr is a home located in Pottawatomie County.
Ownership History
Date
Name
Owned For
Owner Type
Purchase Details
Closed on
Jul 22, 2021
Sold by
Chainakul Wit and Chainakul Pachneerat
Bought by
Chainakul Wit and Chainakul Pachneerat
Current Estimated Value
Purchase Details
Closed on
Nov 15, 2012
Sold by
Tom Brown Homes Inc
Bought by
Chainakul Pachneerat
Home Financials for this Owner
Home Financials are based on the most recent Mortgage that was taken out on this home.
Original Mortgage
$89,000
Interest Rate
3.37%
Mortgage Type
New Conventional
Purchase Details
Closed on
Aug 2, 2012
Sold by
Wood Darrel A and Wood Melba A
Bought by
Tom Brown Homes Inc
Home Financials for this Owner
Home Financials are based on the most recent Mortgage that was taken out on this home.
Original Mortgage
$104,400
Interest Rate
3.68%
Mortgage Type
Purchase Money Mortgage
Purchase Details
Closed on
May 29, 2012
Sold by
Wood Darrel A
Bought by
Wood Darrel A and Wood Melba A
Purchase Details
Closed on
Aug 31, 2000
Sold by
Rick Austin Homes Inc
Bought by
Wood Darrel A
Create a Home Valuation Report for This Property
The Home Valuation Report is an in-depth analysis detailing your home's value as well as a comparison with similar homes in the area
Home Values in the Area
Average Home Value in this Area
Purchase History
| Date | Buyer | Sale Price | Title Company |
|---|---|---|---|
| Chainakul Wit | -- | None Listed On Document | |
| Chainakul Pachneerat | $134,000 | First American Title | |
| Tom Brown Homes Inc | $130,500 | None Available | |
| Wood Darrel A | -- | None Available | |
| Wood Darrel A | $100,000 | -- |
Source: Public Records
Mortgage History
| Date | Status | Borrower | Loan Amount |
|---|---|---|---|
| Previous Owner | Chainakul Pachneerat | $89,000 | |
| Previous Owner | Tom Brown Homes Inc | $104,400 |
Source: Public Records
Tax History Compared to Growth
Tax History
| Year | Tax Paid | Tax Assessment Tax Assessment Total Assessment is a certain percentage of the fair market value that is determined by local assessors to be the total taxable value of land and additions on the property. | Land | Improvement |
|---|---|---|---|---|
| 2024 | $1,405 | $15,520 | $2,180 | $13,340 |
| 2023 | $1,405 | $14,781 | $2,160 | $12,621 |
| 2022 | $1,378 | $14,781 | $2,160 | $12,621 |
| 2021 | $1,391 | $14,781 | $2,160 | $12,621 |
| 2020 | $1,417 | $15,082 | $2,160 | $12,922 |
| 2019 | $1,461 | $15,382 | $2,160 | $13,222 |
| 2018 | $1,471 | $15,397 | $2,160 | $13,237 |
| 2017 | $1,761 | $18,582 | $1,966 | $16,616 |
| 2016 | $1,695 | $17,698 | $1,874 | $15,824 |
| 2015 | $1,425 | $16,854 | $1,857 | $14,997 |
| 2014 | $1,357 | $16,051 | $2,400 | $13,651 |
Source: Public Records
Map
Nearby Homes
- 2205 Gray Dove Dr
- 2253 Gray Dove Dr
- 0 E 45th St
- 00 N Bryan - 100 Acres Ave
- 4408 Lilly Valley St
- 134 Willow Grove Ln
- 3718 N Bryan Ave
- 1104 Adeline
- 4601 Churchill
- 4513 Churchill
- 1400 Mia
- 43512 E 45th St
- 4304 Eloise Dr
- 4306 Eloise Dr
- 4302 Eloise Dr
- 1221 E 42nd St
- 1124 Ariana St
- 0000 N Ridge Road Block 1 Lot 6 Rd
- 0000 N Rd
- 0000 N Ridge Road Block 1 Lot 4 Rd
- 2224 Gray Dove Dr
- 2216 Gray Dove Dr
- 2204 Gray Dove Dr
- 2212 Gray Dove Dr
- 4401 N Bryan Ave
- 2228 Gray Dove Dr
- 2209 Gray Dove Dr
- 2208 Gray Dove Dr
- 4405 N Bryan Ave
- 2232 Gray Dove Dr
- 4411 N Bryan Ave
- 2236 Gray Dove Dr
- 4303 N Bryan Ave
- 2200 Gray Dove Dr
- 4419 N Bryan Ave
- 2240 Gray Dove Dr
- 4301 N Bryan Ave
- 2244 Gray Dove Dr
- 2221 Gray Dove Dr
- 2213 Gray Dove Dr