Estimated Value: $269,000 - $509,000
--
Bed
3
Baths
2,899
Sq Ft
$137/Sq Ft
Est. Value
About This Home
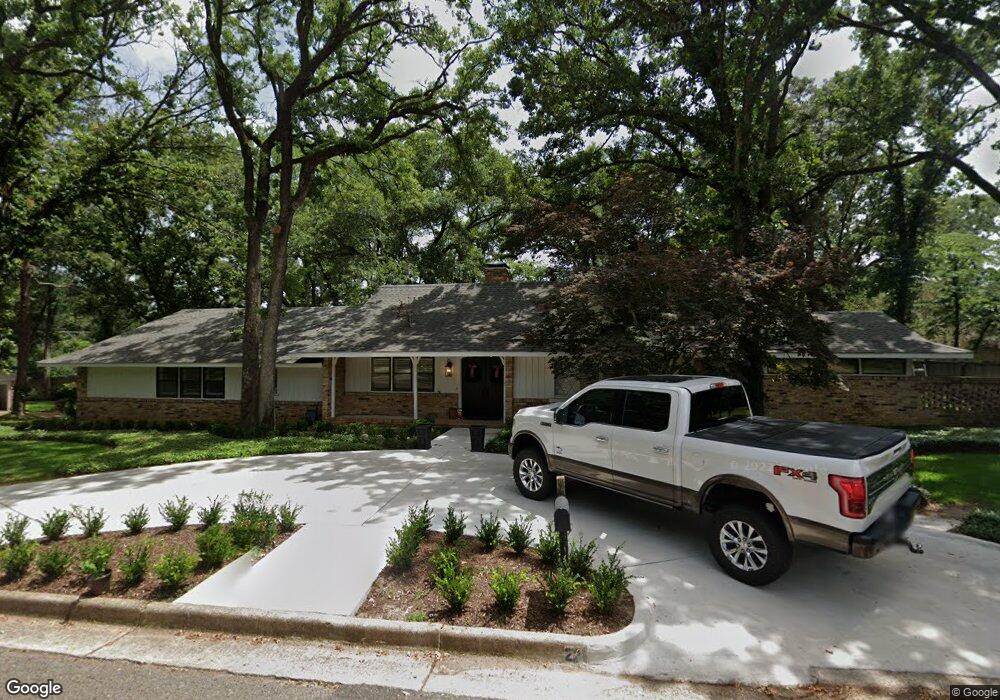
This home is located at 2201 McDonald Rd, Tyler, TX 75701 and is currently estimated at $396,461, approximately $136 per square foot. 2201 McDonald Rd is a home located in Smith County with nearby schools including Clarkston Elementary School, Hubbard Middle School, and Tyler Legacy High School.
Ownership History
Date
Name
Owned For
Owner Type
Purchase Details
Closed on
Jan 29, 2019
Sold by
Kerr Alyssa Lynn and Kerr Walter R
Bought by
Scudder Carl C and Scudder Meredith A
Current Estimated Value
Home Financials for this Owner
Home Financials are based on the most recent Mortgage that was taken out on this home.
Original Mortgage
$251,750
Outstanding Balance
$220,897
Interest Rate
4.6%
Mortgage Type
Purchase Money Mortgage
Estimated Equity
$175,564
Purchase Details
Closed on
Aug 25, 2015
Sold by
Ischy Kyle Fox
Bought by
Kerr Alyssa Lynn and Kerr Walter R
Home Financials for this Owner
Home Financials are based on the most recent Mortgage that was taken out on this home.
Original Mortgage
$223,650
Interest Rate
4.12%
Mortgage Type
New Conventional
Purchase Details
Closed on
Nov 17, 2010
Sold by
Ischy Julie Connor Kidwell
Bought by
Ischy Kyle Fox
Purchase Details
Closed on
Aug 19, 2008
Sold by
Howard Brenda and Ross Brenda J
Bought by
Ischy Kyle and Ischy Julie
Create a Home Valuation Report for This Property
The Home Valuation Report is an in-depth analysis detailing your home's value as well as a comparison with similar homes in the area
Home Values in the Area
Average Home Value in this Area
Purchase History
| Date | Buyer | Sale Price | Title Company |
|---|---|---|---|
| Scudder Carl C | -- | None Available | |
| Kerr Alyssa Lynn | -- | None Available | |
| Ischy Kyle Fox | -- | None Available | |
| Ischy Kyle | -- | None Available |
Source: Public Records
Mortgage History
| Date | Status | Borrower | Loan Amount |
|---|---|---|---|
| Open | Scudder Carl C | $251,750 | |
| Closed | Kerr Alyssa Lynn | $223,650 |
Source: Public Records
Tax History Compared to Growth
Tax History
| Year | Tax Paid | Tax Assessment Tax Assessment Total Assessment is a certain percentage of the fair market value that is determined by local assessors to be the total taxable value of land and additions on the property. | Land | Improvement |
|---|---|---|---|---|
| 2025 | $4,732 | $320,867 | $63,773 | $257,094 |
| 2024 | $4,732 | $336,397 | $48,480 | $287,917 |
| 2023 | $5,579 | $360,224 | $48,480 | $311,744 |
| 2022 | $5,701 | $295,113 | $48,480 | $246,633 |
| 2021 | $5,550 | $264,518 | $42,016 | $222,502 |
| 2020 | $5,374 | $251,135 | $42,016 | $209,119 |
| 2019 | $4,830 | $220,902 | $35,552 | $185,350 |
| 2018 | $4,599 | $211,466 | $32,320 | $179,146 |
| 2017 | $4,515 | $211,466 | $32,320 | $179,146 |
| 2016 | $4,733 | $221,716 | $32,320 | $189,396 |
| 2015 | $4,139 | $211,170 | $32,320 | $178,850 |
| 2014 | $4,139 | $206,641 | $32,320 | $174,321 |
Source: Public Records
Map
Nearby Homes
- 2126 McDonald Rd
- 2010 McDonald Rd
- 2006 McDonald Rd
- 1931 Sterling Dr
- 2026 Neeley St
- 2716 Royal Village Way
- The Dawson Plan at New Home Living at Medina
- 2949 Medina Dr
- The Hubbard Plan at New Home Living at Medina
- 1929 Oakhurst Cir
- 2002 E Faulkner St
- 2014 Miller Dr
- 2509 Delmar Dr
- 2226 Mimosa Dr
- 2320 Sarasota Dr
- 3024 Royal Garden Rd
- 2830 Juniper Ln
- 2512 Alta Mira Dr
- 2515 Preston Ave
- 2716 Roanoke Ln
- 2201 2201 McDonald Rd
- 2110 2110 Sterling Dr
- 2116 Sterling Dr
- 2116 2116 Sterling
- 2110 Sterling Dr
- 2131 McDonald Rd
- 2115 McDonald Rd
- 2021 Sterling Dr
- 2102 Sterling Dr
- 2102 2102 Sterling Dr
- 2126 2126 McDonald
- 2116 McDonald Rd
- 2024 Sterling Dr
- 2110 McDonald Rd
- 2035 Montrose Dr
- 2024 2024 Sterling
- 2025 McDonald Rd
- 2130 McDonald Rd
- 2615 Golden Rd
- 2301 McDonald Rd