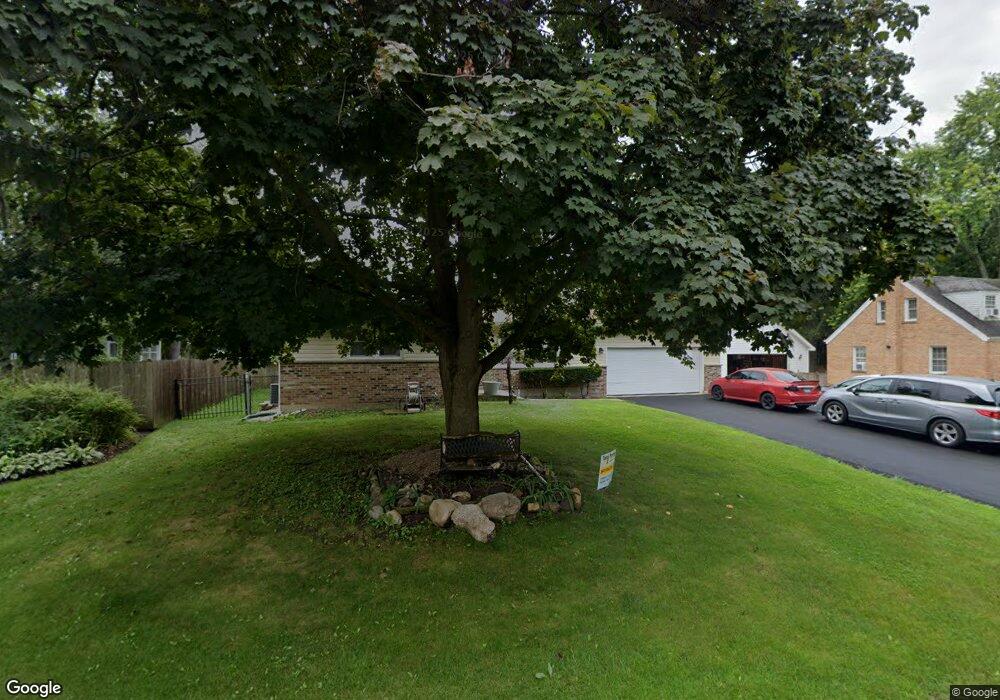
2201 N Bonnie Brook Ln Unit W Waukegan, IL 60087
Bonnie Brook NeighborhoodEstimated Value: $288,000 - $309,000
3
Beds
3
Baths
1,590
Sq Ft
$189/Sq Ft
Est. Value
About This Home
This home is located at 2201 N Bonnie Brook Ln Unit W, Waukegan, IL 60087 and is currently estimated at $299,756, approximately $188 per square foot. 2201 N Bonnie Brook Ln Unit W is a home located in Lake County with nearby schools including Little Fort Elementary School, Jack Benny Middle School, and Waukegan High School.
Ownership History
Date
Name
Owned For
Owner Type
Purchase Details
Closed on
Sep 10, 2010
Sold by
Chen Kay and Byerly Hazel Beth
Bought by
Chen Kay and Chen Juan
Current Estimated Value
Purchase Details
Closed on
Jan 28, 1999
Sold by
Hill Mark A
Bought by
Randall Kay and Byerly Hazel Beth
Home Financials for this Owner
Home Financials are based on the most recent Mortgage that was taken out on this home.
Original Mortgage
$152,966
Outstanding Balance
$36,237
Interest Rate
6.75%
Mortgage Type
FHA
Estimated Equity
$263,519
Purchase Details
Closed on
Sep 11, 1997
Sold by
Hill Kathleen M
Bought by
Hill Mark A
Home Financials for this Owner
Home Financials are based on the most recent Mortgage that was taken out on this home.
Original Mortgage
$114,500
Interest Rate
7.65%
Mortgage Type
Balloon
Create a Home Valuation Report for This Property
The Home Valuation Report is an in-depth analysis detailing your home's value as well as a comparison with similar homes in the area
Home Values in the Area
Average Home Value in this Area
Purchase History
| Date | Buyer | Sale Price | Title Company |
|---|---|---|---|
| Chen Kay | -- | None Available | |
| Randall Kay | $154,000 | 1St American Title | |
| Hill Mark A | -- | First American Title |
Source: Public Records
Mortgage History
| Date | Status | Borrower | Loan Amount |
|---|---|---|---|
| Open | Randall Kay | $152,966 | |
| Previous Owner | Hill Mark A | $114,500 |
Source: Public Records
Tax History Compared to Growth
Tax History
| Year | Tax Paid | Tax Assessment Tax Assessment Total Assessment is a certain percentage of the fair market value that is determined by local assessors to be the total taxable value of land and additions on the property. | Land | Improvement |
|---|---|---|---|---|
| 2024 | $6,020 | $89,090 | $13,056 | $76,034 |
| 2023 | $5,937 | $79,839 | $11,774 | $68,065 |
| 2022 | $5,937 | $71,730 | $11,165 | $60,565 |
| 2021 | $5,271 | $61,556 | $9,789 | $51,767 |
| 2020 | $5,254 | $57,347 | $9,120 | $48,227 |
| 2019 | $5,191 | $52,549 | $8,357 | $44,192 |
| 2018 | $5,474 | $54,039 | $11,456 | $42,583 |
| 2017 | $5,236 | $47,809 | $10,135 | $37,674 |
| 2016 | $3,982 | $36,766 | $7,794 | $28,972 |
| 2015 | $3,700 | $32,906 | $6,976 | $25,930 |
| 2014 | $3,642 | $32,514 | $8,588 | $23,926 |
| 2012 | $5,249 | $35,225 | $9,304 | $25,921 |
Source: Public Records
Map
Nearby Homes
- 2613 N Lewis Ave
- 3211 Rugby Ct
- 3101 Country Club Ln
- 1612 Whitney St
- 1636 Rice St
- 12312 W Audrey Ave
- 2350 N Lewis Ave
- 2708 Dana Ave
- 2705 Dana Ave
- 37966 N Cornell Rd
- 3411 N Lewis Ave
- 2713 Varonen Ave
- 36955 N Garrick Ave
- 3032 W Vermont Ave
- 37905 N Loyola Ave
- 38127 N Shore Ave
- 38362 N Manor Ave
- 2232 Walnut St
- 36245 N Green Bay Rd
- 1913 Chippewa Rd
- 2211 N Bonnie Brook Ln Unit W
- 2141 N Bonnie Brook Ln Unit W
- 2217 N Bonnie Brook Ln Unit W
- 2135 N Bonnie Brook Ln Unit W
- 2206 Hawthorne Ln
- 2142 Hawthorne Ln
- 2212 Hawthorne Ln
- 2210 N Bonnie Brook Ln Unit W
- 2136 Hawthorne Ln
- 2216 Hawthorne Ln
- 2129 N Bonnie Brook Ln Unit W
- 2130 N Bonnie Brook Ln Unit W
- 2220 N Bonnie Brook Ln Unit W
- 2301 N Bonnie Brook Ln Unit W
- 2130 Hawthorne Ln
- 2918 Meadowlark Ln
- 2220 Hawthorne Ln
- 2123 N Bonnie Brook Ln Unit W
- 2120 N Bonnie Brook Ln Unit W
- 2124 Hawthorne Ln