2201 Redwood Cir NE Palm Bay, FL 32905
Port Malabar NeighborhoodEstimated Value: $274,000 - $288,000
3
Beds
2
Baths
1,292
Sq Ft
$218/Sq Ft
Est. Value
About This Home
This home is located at 2201 Redwood Cir NE, Palm Bay, FL 32905 and is currently estimated at $281,987, approximately $218 per square foot. 2201 Redwood Cir NE is a home located in Brevard County with nearby schools including Palm Bay Elementary School, Stone Magnet Middle School, and Palm Bay Magnet Senior High School.
Ownership History
Date
Name
Owned For
Owner Type
Purchase Details
Closed on
Dec 15, 2010
Sold by
Federal Home Loan Mortgage Corporation
Bought by
Groover William L and Groover Dolores C
Current Estimated Value
Purchase Details
Closed on
Sep 23, 2010
Sold by
Branch Banking & Trust Company
Bought by
Federal Home Loan Mortgage Corp
Purchase Details
Closed on
Aug 31, 2010
Sold by
Wiles Michael and The Courtyards At Sandy Pines
Bought by
Branch Banking & Trust Company
Purchase Details
Closed on
Dec 31, 2002
Sold by
Maronda Homes Inc Fl
Bought by
Wiles Michael Owen
Home Financials for this Owner
Home Financials are based on the most recent Mortgage that was taken out on this home.
Original Mortgage
$83,000
Interest Rate
6.01%
Purchase Details
Closed on
Oct 18, 2002
Sold by
Cooper James J and Cooper Felicia
Bought by
Maronda Homes Inc
Purchase Details
Closed on
Apr 30, 2001
Sold by
Sorber Howard E
Bought by
Hock Timothy P and Hock Sandra L
Create a Home Valuation Report for This Property
The Home Valuation Report is an in-depth analysis detailing your home's value as well as a comparison with similar homes in the area
Home Values in the Area
Average Home Value in this Area
Purchase History
| Date | Buyer | Sale Price | Title Company |
|---|---|---|---|
| Groover William L | $70,000 | New House Title | |
| Federal Home Loan Mortgage Corp | -- | New House Title | |
| Branch Banking & Trust Company | -- | Attorney | |
| Wiles Michael Owen | $92,500 | -- | |
| Maronda Homes Inc | -- | -- | |
| Cooper James J | $92,500 | -- | |
| Hock Timothy P | $103,000 | -- |
Source: Public Records
Mortgage History
| Date | Status | Borrower | Loan Amount |
|---|---|---|---|
| Previous Owner | Wiles Michael Owen | $83,000 |
Source: Public Records
Tax History Compared to Growth
Tax History
| Year | Tax Paid | Tax Assessment Tax Assessment Total Assessment is a certain percentage of the fair market value that is determined by local assessors to be the total taxable value of land and additions on the property. | Land | Improvement |
|---|---|---|---|---|
| 2025 | $4,013 | $227,870 | -- | -- |
| 2024 | $3,901 | $237,020 | -- | -- |
| 2023 | $3,901 | $246,790 | $0 | $0 |
| 2022 | $3,441 | $208,230 | $0 | $0 |
| 2021 | $3,146 | $157,290 | $30,000 | $127,290 |
| 2020 | $2,840 | $140,250 | $22,000 | $118,250 |
| 2019 | $2,992 | $137,840 | $22,000 | $115,840 |
| 2018 | $2,776 | $133,650 | $22,000 | $111,650 |
| 2017 | $2,678 | $122,420 | $20,000 | $102,420 |
| 2016 | $2,375 | $115,470 | $20,000 | $95,470 |
| 2015 | $2,197 | $93,790 | $20,000 | $73,790 |
| 2014 | $2,026 | $85,270 | $20,000 | $65,270 |
Source: Public Records
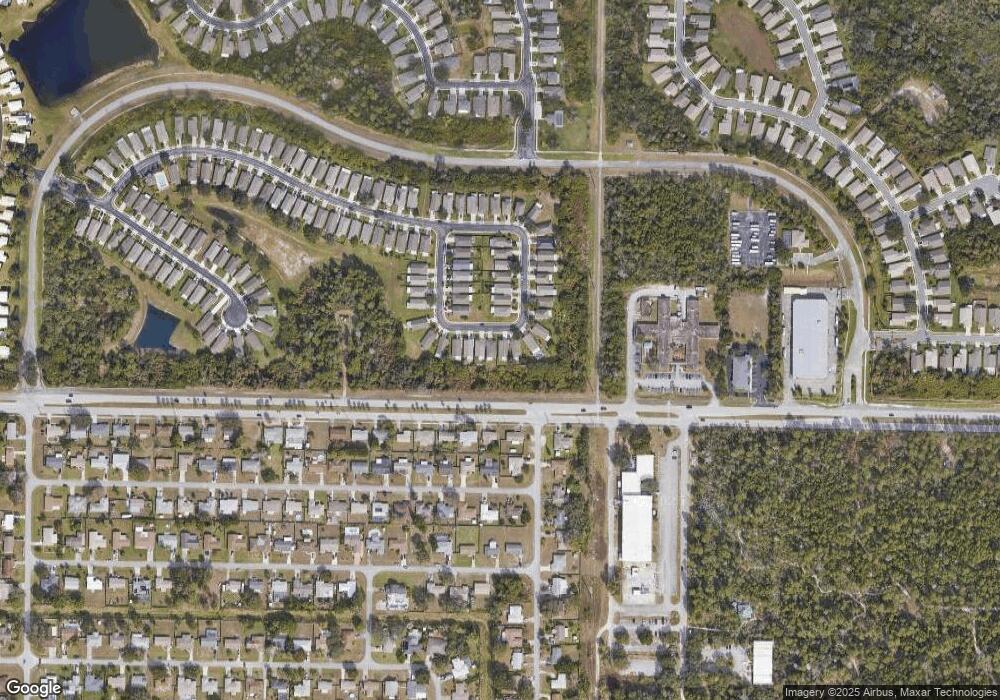
Map
Nearby Homes
- 2163 Advana St NE
- 2268 Spring Creek Cir NE
- 704 Cavio Ave NE Unit 5
- 1067 Pine Creek Cir NE
- 1007 Pine Creek Cir NE
- 1190 Pine Creek Cir NE
- 926 Pine Creek Cir NE
- 918 Pine Creek Cir NE
- 2248 Spring Creek Cir NE
- 2221 Spring Creek Cir NE
- 2214 Spring Creek Cir NE
- 2210 Spring Creek Cir NE
- 2187 Spring Creek Cir NE
- 2183 Spring Creek Cir NE
- 2101 Acacia St NE
- 2145 Beekman St NE
- 2025 Acacia St NE
- 1924 Elderberry Ct NE
- 2066 Acacia St NE
- 2035 Marlberry Ct NE
- 2197 Redwood Cir NE
- 2205 Redwood Cir NE
- 2209 Redwood Cir NE
- 2193 Redwood Cir NE
- 2213 Redwood Cir NE
- 2188 Redwood Cir NE
- 2189 Redwood Cir NE
- 2220 Redwood Cir NE
- 2184 Redwood Cir NE
- 2217 Redwood Cir NE
- 2226 Redwood Cir NE
- 2181 Redwood Cir NE
- 2230 Redwood Cir NE
- 2221 Redwood Cir NE
- 2177 Redwood Cir NE
- 2172 Redwood Cir NE
- 2225 Redwood Cir
- 2236 Redwood Cir NE
- 2173 Redwood Cir NE