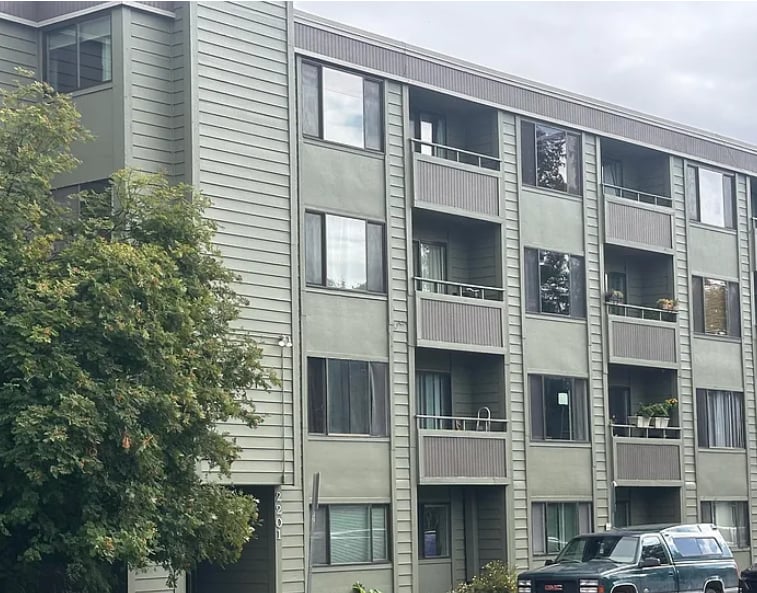
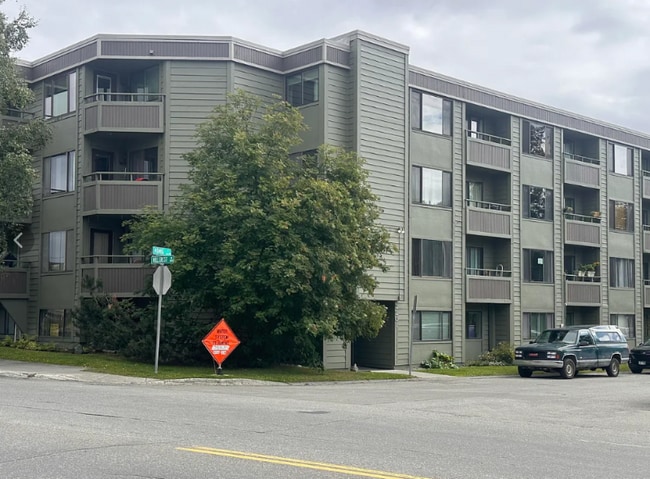

2201 Romig Place Unit 301 Anchorage, AK 99503
North Star Neighborhood
2
Beds
1
Bath
800
Sq Ft
1977
Built
About This Home
Property Id: 2218277
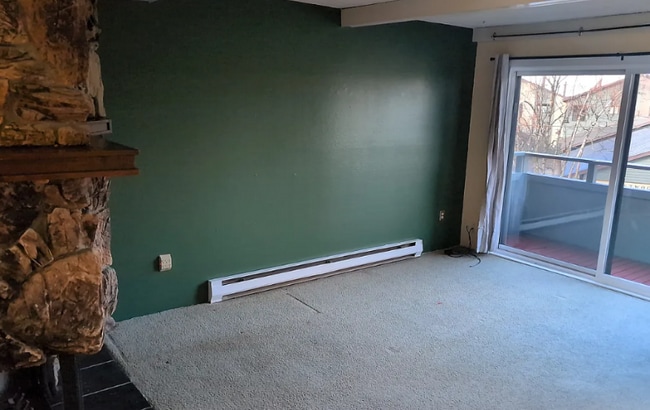
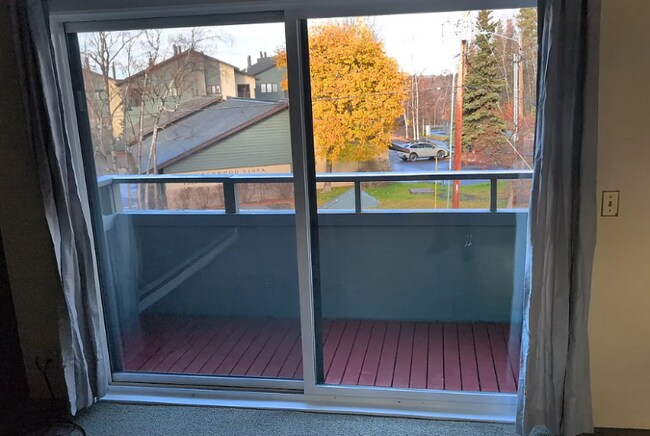
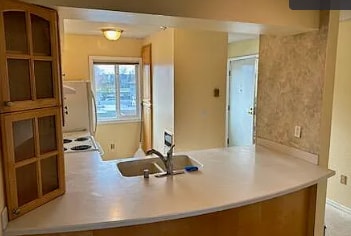
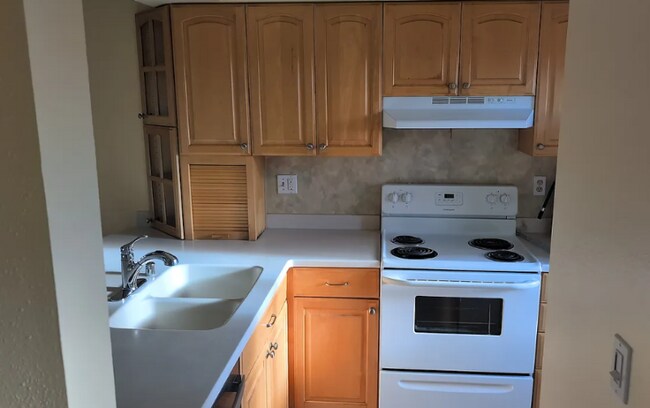
This is a wonderful two bedroom, one bath condominium with in-unit clothes washer and dryer and covered parking. It is close to Westchester lagoon, Chester Creek trail, the coastal trail, and downtown. There is also a shared sundeck for barbecuing and summer fun. The condominium complex is friendly, safe, access controlled, and well maintained. Highly recommended! The owner lives nearby and repair and maintenance is prompt and professional. Nicely sized for mid-town living at 700+ square feet. Large windows let in plenty of light and provide a nice view of the mountains and surrounding neighborhood. Also plenty of closets with built-in shelving and storage and a modern kitchen with dishwasher and in-sink garbage
Listing Provided By

Map
Nearby Homes
- 2201 Romig Place Unit 105
- 1350 Hillcrest Dr
- 1327 W 25th Ave Unit 218
- 1435 W 25th Ave
- 1113 W Fireweed Ln Unit 505
- 1113 W Fireweed Ln Unit 402
- 1945 Spenard Rd
- 1471 W 26th Ave
- 1441 W 26th Ave Unit B3
- 1024 Potlatch Cir Unit 23
- 1001 W Fireweed Ln
- 1016 W 25th Ave
- 827 W 20th Ave
- 1908 Hillcrest Dr Unit 17
- 2064 Belair Dr
- 2607 Arctic Blvd
- 1501 P St
- 1102 W 29th Ave
- 1010 W 29th Place
- 1439 P St
- 2201 Romig Place Unit 106
- 2201 Romig Place Unit 208
- 1303 W 23rd Ave
- 1435 W 25th Ave Unit 7
- 1435 W 25th Ave Unit 1
- 1130 W 26th Ave Unit 206
- 1130 W 26th Ave Unit 203
- 1046 W 26th Ave
- 915 W 27th Ave
- 701 W 19th Ave
- 1009 W 30th Ave Unit 7
- 1009 W 30th Ave Unit 10
- 808 W 29th Place Unit 7
- 808 W 29th Place Unit 3
- 1825 W 15th Ave Unit 10
- 1854 Buccaneer Place Unit 2
- 423 W 22nd Ave
- 2300 D St
- 712 W 14th Ave
- 1200 I St Unit 310