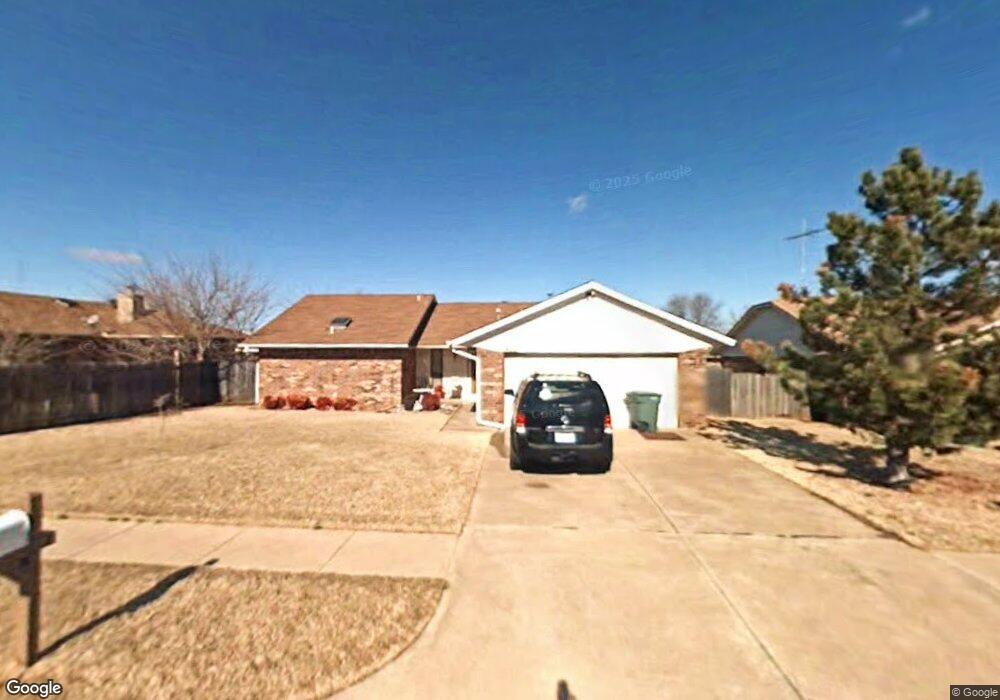
2201 Rushing Springs Trail Edmond, OK 73013
Traditions-Ripple Creek NeighborhoodEstimated Value: $215,747 - $236,000
3
Beds
2
Baths
1,398
Sq Ft
$160/Sq Ft
Est. Value
About This Home
This home is located at 2201 Rushing Springs Trail, Edmond, OK 73013 and is currently estimated at $223,937, approximately $160 per square foot. 2201 Rushing Springs Trail is a home located in Oklahoma County with nearby schools including Sunset Elementary School, Summit Middle School, and Santa Fe High School.
Ownership History
Date
Name
Owned For
Owner Type
Purchase Details
Closed on
Jan 11, 2018
Sold by
Sadeghi Parvaneh
Bought by
Sadeghi Parvaneh and Bina Maryam
Current Estimated Value
Purchase Details
Closed on
May 11, 2012
Sold by
Curry Kenneth and Curry Cynthia
Bought by
Sadeghi Parvaneh
Home Financials for this Owner
Home Financials are based on the most recent Mortgage that was taken out on this home.
Original Mortgage
$112,917
Outstanding Balance
$77,682
Interest Rate
3.75%
Mortgage Type
FHA
Estimated Equity
$146,255
Purchase Details
Closed on
Jul 26, 2011
Sold by
Hendrick Cynthia Jean and Hendrick Tommy
Bought by
Curry Kenneth and Curry Cynthia
Home Financials for this Owner
Home Financials are based on the most recent Mortgage that was taken out on this home.
Original Mortgage
$87,200
Interest Rate
4.53%
Mortgage Type
New Conventional
Create a Home Valuation Report for This Property
The Home Valuation Report is an in-depth analysis detailing your home's value as well as a comparison with similar homes in the area
Home Values in the Area
Average Home Value in this Area
Purchase History
| Date | Buyer | Sale Price | Title Company |
|---|---|---|---|
| Sadeghi Parvaneh | -- | The Oklahoma City Abs & Tit | |
| Sadeghi Parvaneh | $115,000 | The Oklahoma City Abstract & | |
| Curry Kenneth | $109,000 | Stewart Abstract & Title Ok |
Source: Public Records
Mortgage History
| Date | Status | Borrower | Loan Amount |
|---|---|---|---|
| Open | Sadeghi Parvaneh | $112,917 | |
| Previous Owner | Curry Kenneth | $87,200 |
Source: Public Records
Tax History Compared to Growth
Tax History
| Year | Tax Paid | Tax Assessment Tax Assessment Total Assessment is a certain percentage of the fair market value that is determined by local assessors to be the total taxable value of land and additions on the property. | Land | Improvement |
|---|---|---|---|---|
| 2024 | $1,518 | $16,031 | $2,459 | $13,572 |
| 2023 | $1,518 | $15,565 | $2,555 | $13,010 |
| 2022 | $1,477 | $15,112 | $2,896 | $12,216 |
| 2021 | $1,424 | $14,672 | $3,119 | $11,553 |
| 2020 | $1,396 | $14,245 | $3,168 | $11,077 |
| 2019 | $1,370 | $13,935 | $3,017 | $10,918 |
| 2018 | $1,335 | $13,530 | $0 | $0 |
| 2017 | $1,358 | $13,804 | $2,477 | $11,327 |
| 2016 | $1,320 | $13,474 | $2,477 | $10,997 |
| 2015 | $1,291 | $13,215 | $2,461 | $10,754 |
| 2014 | $1,249 | $12,831 | $2,477 | $10,354 |
Source: Public Records
Map
Nearby Homes
- 2200 Lazy Brook Trail
- 2201 Tracys Terrace
- 100 Pueblo
- 1916 Woodside Dr
- 2013 Tanglewood Dr
- 116 Pueblo
- 16304 Bandera
- 2104 Tanglewood Dr
- 16001 Sheffield Blvd
- 201 NW 160th Terrace
- 1917 Fountain View
- 217 NW 160th Terrace
- 1704 Magnolia Ln
- 16408 Del Mar Dr
- 1908 Magnolia Ln
- 1909 Magnolia Ln
- 1912 Whispering Creek Dr
- 17 Red Admiral Way
- 25 Red Admiral Way
- 15536 Monarch Ln
- 2121 Rushing Springs Trail
- 2004 Tracys Terrace
- 2120 Lazy Brook Trail
- 2204 Lazy Brook Trail
- 2117 Rushing Springs Trail
- 2200 Rushing Springs Trail
- 2116 Lazy Brook Trail
- 2120 Rushing Springs Trail
- 2204 Rushing Springs Trail
- 2113 Rushing Springs Trail
- 2116 Rushing Springs Trail
- 2009 Tracys Terrace
- 2112 Lazy Brook Trail
- 2005 Tracys Terrace
- 2013 Tracys Terrace
- 2112 Rushing Springs Trail
- 2001 Tracys Terrace
- 2101 Tracys Terrace
- 2109 Rushing Springs Trail
- 2201 Vanishing Trail