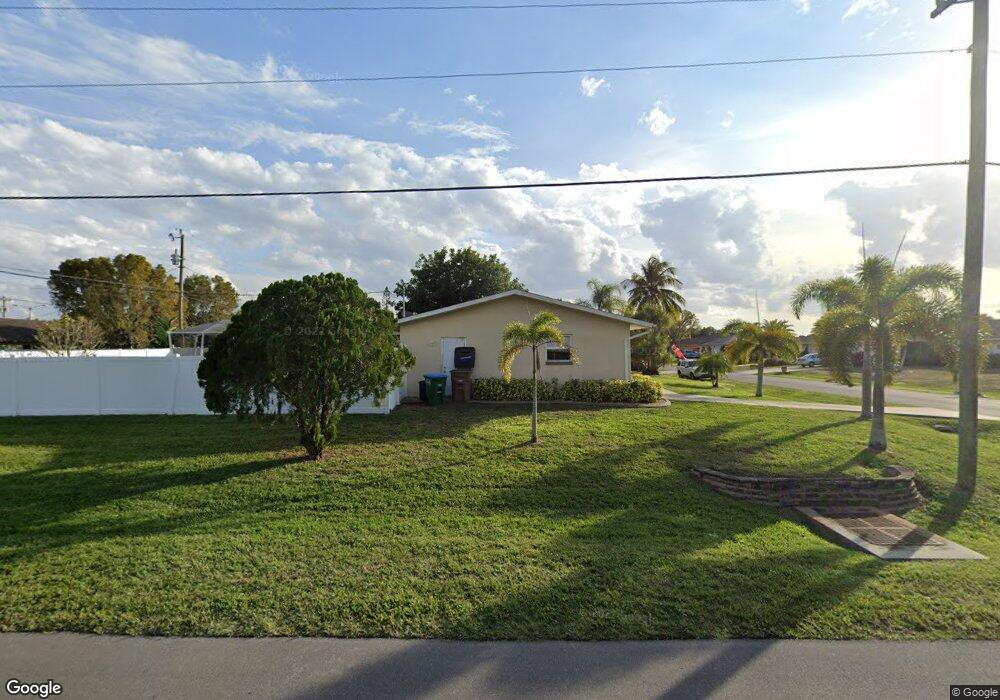
2201 SE 8th Place Cape Coral, FL 33990
Hancock NeighborhoodEstimated Value: $290,000 - $331,000
2
Beds
2
Baths
1,217
Sq Ft
$253/Sq Ft
Est. Value
About This Home
This home is located at 2201 SE 8th Place, Cape Coral, FL 33990 and is currently estimated at $307,682, approximately $252 per square foot. 2201 SE 8th Place is a home located in Lee County with nearby schools including Caloosa Elementary School, Cape Elementary School, and Tropic Isles Elementary School.
Ownership History
Date
Name
Owned For
Owner Type
Purchase Details
Closed on
Jun 7, 2013
Sold by
Kochanny Paul and Kochanny Tracie
Bought by
Bridges Lucinda
Current Estimated Value
Home Financials for this Owner
Home Financials are based on the most recent Mortgage that was taken out on this home.
Original Mortgage
$126,663
Outstanding Balance
$89,131
Interest Rate
3.25%
Mortgage Type
FHA
Estimated Equity
$218,551
Purchase Details
Closed on
Jul 25, 2012
Sold by
Frankson Samuel Lee and Frankson Holly Lynn
Bought by
Kochanny Paul and Kochanny Tracie
Home Financials for this Owner
Home Financials are based on the most recent Mortgage that was taken out on this home.
Original Mortgage
$91,920
Interest Rate
3.68%
Mortgage Type
New Conventional
Purchase Details
Closed on
Mar 1, 2011
Sold by
North American Communities Llc
Bought by
Frankson Samuel Lee and Frankson Holly Lynn
Home Financials for this Owner
Home Financials are based on the most recent Mortgage that was taken out on this home.
Original Mortgage
$68,000
Interest Rate
4.77%
Mortgage Type
New Conventional
Purchase Details
Closed on
Aug 20, 2010
Sold by
Price Paula J
Bought by
North American Communities Llc
Create a Home Valuation Report for This Property
The Home Valuation Report is an in-depth analysis detailing your home's value as well as a comparison with similar homes in the area
Home Values in the Area
Average Home Value in this Area
Purchase History
| Date | Buyer | Sale Price | Title Company |
|---|---|---|---|
| Bridges Lucinda | $129,000 | Attorney | |
| Kochanny Paul | $114,900 | Attorney | |
| Frankson Samuel Lee | $87,500 | None Available | |
| North American Communities Llc | $50,000 | None Available |
Source: Public Records
Mortgage History
| Date | Status | Borrower | Loan Amount |
|---|---|---|---|
| Open | Bridges Lucinda | $126,663 | |
| Previous Owner | Kochanny Paul | $91,920 | |
| Previous Owner | Frankson Samuel Lee | $68,000 |
Source: Public Records
Tax History Compared to Growth
Tax History
| Year | Tax Paid | Tax Assessment Tax Assessment Total Assessment is a certain percentage of the fair market value that is determined by local assessors to be the total taxable value of land and additions on the property. | Land | Improvement |
|---|---|---|---|---|
| 2025 | $2,065 | $112,007 | -- | -- |
| 2024 | $1,937 | $117,576 | -- | -- |
| 2023 | $1,937 | $114,151 | $0 | $0 |
| 2022 | $1,760 | $110,826 | $0 | $0 |
| 2021 | $1,723 | $159,274 | $38,113 | $121,161 |
| 2020 | $1,723 | $106,112 | $0 | $0 |
| 2019 | $1,659 | $103,726 | $0 | $0 |
| 2018 | $1,638 | $101,792 | $0 | $0 |
| 2017 | $1,598 | $99,698 | $0 | $0 |
| 2016 | $1,550 | $119,593 | $23,688 | $95,905 |
| 2015 | $1,535 | $104,602 | $20,147 | $84,455 |
| 2014 | -- | $96,198 | $19,681 | $76,517 |
| 2013 | -- | $87,001 | $11,400 | $75,601 |
Source: Public Records
Map
Nearby Homes
- 1449 SE 22nd St
- 908 SE 21st Terrace
- 2114 SE 8th Place
- 2201 SE 10th Ave
- 627 SE 22nd Terrace
- 2326 SE 8th Ave
- 620 SE 22nd St
- 624 SE 23rd Terrace
- 610 SE 22nd Terrace
- 2419 Country Club Blvd
- 2416 SE 8th Ave
- 2016 Academy Blvd
- 915 SE 20th St
- 2114 SE 11th Place
- 622 SE 20th St
- 1942 SE 8th Place
- 910 SE 19th Ln
- 147 SE 21st Ln
- 1105 SE 23rd St
- 624 SE 19th Ln
- 2205 SE 8th Place
- 2202 Country Club Blvd
- 2147 SE 8th Place
- 2206 Country Club Blvd
- 2209 SE 8th Place
- 2202 SE 8th Place Unit 21
- 2206 SE 8th Place
- 2148 Country Club Blvd
- 2210 Country Club Blvd
- 2148 SE 8th Place
- 2210 SE 8th Place
- 2213 SE 8th Place
- 2214 Country Club Blvd
- 2144 SE 8th Place
- 2142 Country Club Blvd
- 2214 SE 8th Place
- 2203 SE 8th Ave
- 2217 SE 8th Place
- 2139 SE 8th Place
- 2207 SE 8th Ave