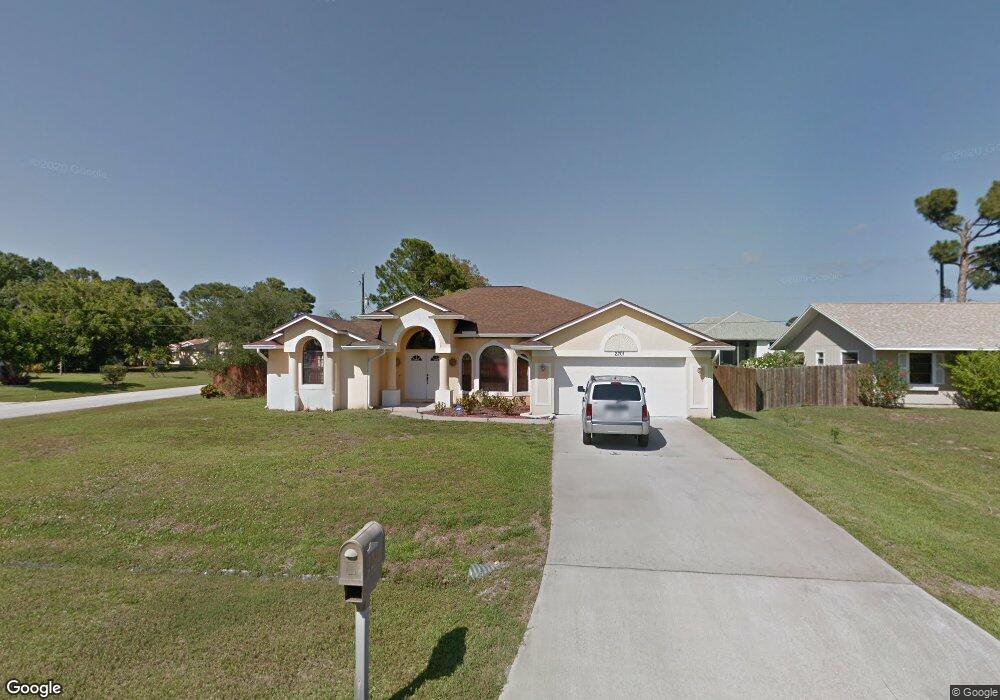
2201 SE Gaslight St Port Saint Lucie, FL 34952
Sandhill Crossing NeighborhoodEstimated Value: $389,000 - $451,000
3
Beds
2
Baths
2,053
Sq Ft
$210/Sq Ft
Est. Value
About This Home
This home is located at 2201 SE Gaslight St, Port Saint Lucie, FL 34952 and is currently estimated at $430,406, approximately $209 per square foot. 2201 SE Gaslight St is a home located in St. Lucie County with nearby schools including Mariposa Elementary School, Morningside Elementary School, and Floresta Elementary School.
Ownership History
Date
Name
Owned For
Owner Type
Purchase Details
Closed on
Aug 23, 2023
Sold by
Daniels Frederick J and Daniels Veronica
Bought by
Daniels Living Trust and Daniels
Current Estimated Value
Purchase Details
Closed on
Jul 25, 2023
Sold by
Rodriguez Veronica and Daniels Frederick J
Bought by
Daniels Veronica and Daniels Frederick J
Purchase Details
Closed on
Dec 20, 2002
Sold by
St Lucie Lots Inc
Bought by
Daniels Frederick J and Rodriguez Veronica
Home Financials for this Owner
Home Financials are based on the most recent Mortgage that was taken out on this home.
Original Mortgage
$10,000
Interest Rate
5.99%
Purchase Details
Closed on
Nov 22, 2002
Sold by
Krois Herbert and Krois Carole
Bought by
St Lucie Lots Inc
Home Financials for this Owner
Home Financials are based on the most recent Mortgage that was taken out on this home.
Original Mortgage
$10,000
Interest Rate
5.99%
Create a Home Valuation Report for This Property
The Home Valuation Report is an in-depth analysis detailing your home's value as well as a comparison with similar homes in the area
Home Values in the Area
Average Home Value in this Area
Purchase History
| Date | Buyer | Sale Price | Title Company |
|---|---|---|---|
| Daniels Living Trust | $100 | None Listed On Document | |
| Daniels Living Trust | $100 | None Listed On Document | |
| Daniels Veronica | $100 | None Listed On Document | |
| Daniels Frederick J | $12,900 | -- | |
| St Lucie Lots Inc | $5,000 | -- |
Source: Public Records
Mortgage History
| Date | Status | Borrower | Loan Amount |
|---|---|---|---|
| Previous Owner | Daniels Frederick J | $10,000 |
Source: Public Records
Tax History Compared to Growth
Tax History
| Year | Tax Paid | Tax Assessment Tax Assessment Total Assessment is a certain percentage of the fair market value that is determined by local assessors to be the total taxable value of land and additions on the property. | Land | Improvement |
|---|---|---|---|---|
| 2024 | $3,060 | $155,184 | -- | -- |
| 2023 | $3,060 | $150,665 | $0 | $0 |
| 2022 | $2,924 | $146,277 | $0 | $0 |
| 2021 | $2,835 | $142,017 | $0 | $0 |
| 2020 | $2,846 | $140,057 | $0 | $0 |
| 2019 | $2,814 | $136,909 | $0 | $0 |
| 2018 | $2,670 | $134,357 | $0 | $0 |
| 2017 | $2,637 | $176,100 | $29,900 | $146,200 |
| 2016 | $2,597 | $178,600 | $23,100 | $155,500 |
| 2015 | $2,622 | $150,600 | $15,400 | $135,200 |
| 2014 | $2,491 | $126,977 | $0 | $0 |
Source: Public Records
Map
Nearby Homes
- 2151 SE Bowie St
- 2255 SE Gaslight St
- 2267 SE Heathwood Cir
- 2234 SE Heathwood Cir
- 2283 SE Gaslight St
- 2109 SE Trillo St
- 2111 SE Cayuga Ct
- 2290 W Blackwell D
- 2290 SE West Blackwell Dr
- 2725 SE Garfield Ave
- 2050 SE Ellington Terrace
- 2265 SE Blackwell Dr
- 2289 SE West Blackwell Dr
- 2308 SE West Blackwell Dr
- 2302 SE Melaleuca Blvd
- 2854 SE Melaleuca Blvd
- 2701 SE Bishop Ave
- 2801 SE Hutchings Ave
- 2440 SE Toledo Ave
- 2501 SE Melaleuca Blvd
- 2207 SE Gaslight St
- 2202 SE Genoa St
- 2210 SE Genoa St
- 2213 SE Gaslight St
- 2202 SE Gaslight St
- 2198 SE Genoa St
- 2661 SE Osage Ave
- 2208 SE Gaslight St
- 2218 SE Genoa St
- 2631 SE Osage Ave
- 2214 SE Gaslight St
- 2190 SE Genoa St
- 2226 SE Genoa St
- 2188 SE Gaslight St
- 2201 SE Trillo St
- 2201 SE Genoa St
- 2209 SE Genoa St
- 2220 SE Gaslight St
- 2225 SE Gaslight St