Estimated Value: $288,000 - $349,000
3
Beds
1
Bath
3,280
Sq Ft
$95/Sq Ft
Est. Value
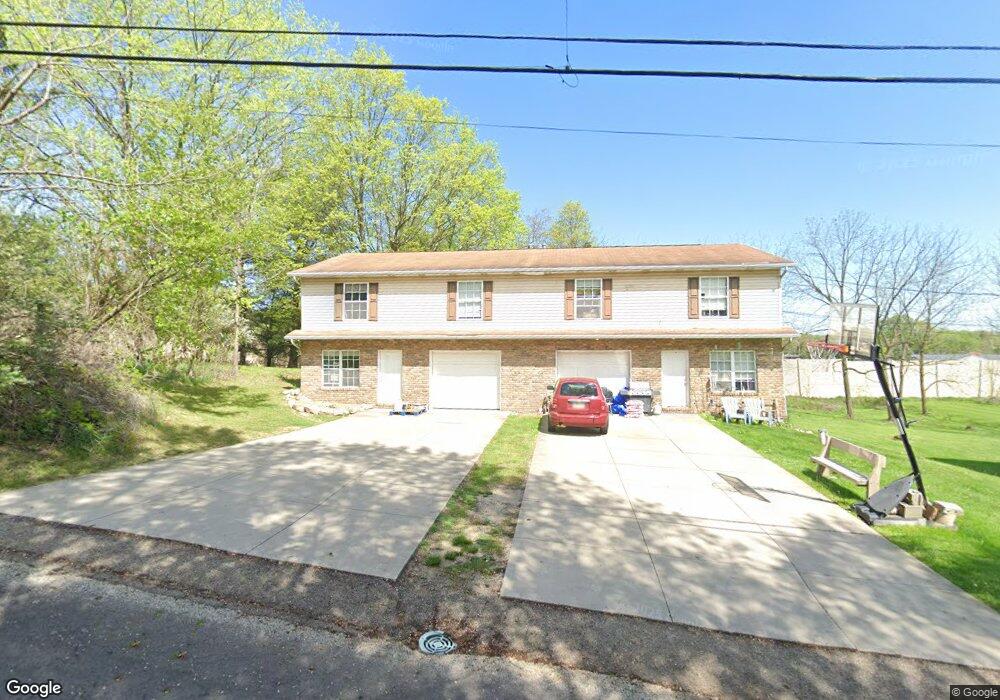
About This Home
This home is located at 2201 Stahl Rd Unit 2203, Akron, OH 44319 and is currently estimated at $312,128, approximately $95 per square foot. 2201 Stahl Rd Unit 2203 is a home located in Summit County with nearby schools including Springfield High School, Eagle Elementary, and Chapel Hill Christian School-Green Campus.
Ownership History
Date
Name
Owned For
Owner Type
Purchase Details
Closed on
Mar 31, 2014
Sold by
Dotson Terry M
Bought by
Dotson Terry M and Dotson Kim J
Current Estimated Value
Purchase Details
Closed on
Oct 13, 2013
Sold by
Bank Of New York Mellon
Bought by
Dotson Terry M
Purchase Details
Closed on
Jul 24, 2013
Sold by
Edwards Terri L and Edwards Gary D
Bought by
The Bank Of New York Mellon and The Bank Of New York
Purchase Details
Closed on
Mar 13, 1997
Sold by
Ziler Harold H
Bought by
Edwards Gary D and Edwards Terri
Home Financials for this Owner
Home Financials are based on the most recent Mortgage that was taken out on this home.
Original Mortgage
$84,840
Interest Rate
7.95%
Mortgage Type
New Conventional
Create a Home Valuation Report for This Property
The Home Valuation Report is an in-depth analysis detailing your home's value as well as a comparison with similar homes in the area
Home Values in the Area
Average Home Value in this Area
Purchase History
| Date | Buyer | Sale Price | Title Company |
|---|---|---|---|
| Dotson Terry M | -- | None Available | |
| Dotson Terry M | $86,678 | Prism Title & Closing Ser | |
| The Bank Of New York Mellon | $138,000 | None Available | |
| Edwards Gary D | $84,000 | -- |
Source: Public Records
Mortgage History
| Date | Status | Borrower | Loan Amount |
|---|---|---|---|
| Previous Owner | Edwards Gary D | $84,840 |
Source: Public Records
Tax History Compared to Growth
Tax History
| Year | Tax Paid | Tax Assessment Tax Assessment Total Assessment is a certain percentage of the fair market value that is determined by local assessors to be the total taxable value of land and additions on the property. | Land | Improvement |
|---|---|---|---|---|
| 2025 | $4,865 | $82,985 | $11,480 | $71,505 |
| 2024 | $4,865 | $82,985 | $11,480 | $71,505 |
| 2023 | $4,865 | $82,985 | $11,480 | $71,505 |
| 2022 | $4,455 | $64,331 | $8,901 | $55,430 |
| 2021 | $4,220 | $64,331 | $8,901 | $55,430 |
| 2020 | $4,142 | $64,330 | $8,900 | $55,430 |
| 2019 | $4,512 | $64,340 | $6,920 | $57,420 |
| 2018 | $4,456 | $64,340 | $6,920 | $57,420 |
| 2017 | $3,610 | $64,340 | $6,920 | $57,420 |
| 2016 | $3,643 | $52,500 | $6,920 | $45,580 |
| 2015 | $3,610 | $52,500 | $6,920 | $45,580 |
| 2014 | $3,457 | $52,500 | $6,920 | $45,580 |
| 2013 | $6,688 | $73,630 | $6,920 | $66,710 |
Source: Public Records
Map
Nearby Homes
- 2057 Darnell Dr
- 2025 S Plaza Dr
- 1043 Krumroy Rd
- 2218 Lee Dr
- 580 Colchester Ct
- 0 Woodview Dr
- 2171 Canterbury Cir
- 1333 Derbydale Rd
- 2069 Penguin Ave
- 1674 Betz Dr
- 1658 Betz Dr
- 1649 Betz Dr
- 1872 Pickle Rd
- 1645 Hammel St
- 3025 Lamb Dr
- 71 Delora Dr
- 1899 Edwards Dr
- 3071 Elderberry Ave
- 1576 Hammel St
- 1575 Faye Rd
- 2211 Stahl Rd Unit 2213
- 2203 Stahl Rd
- 2211 2213 Stahl Rd
- 2185 Stahl Rd
- 2213 Stahl Rd
- 2217 Stahl Rd Unit 2219
- 2188 Stahl Rd
- 2219 Stahl Rd
- 2171 Stahl Rd
- 2200 Stahl Rd
- 2176 Stahl Rd
- 2216 Stahl Rd
- 2170 Stahl Rd
- 2157 Stahl Rd
- 2243 Stahl Rd
- 2158 Stahl Rd
- 2160 Stahl Rd
- 2160 Stahl Rd
- 951 Thierry Ave
- 953 Thierry Ave