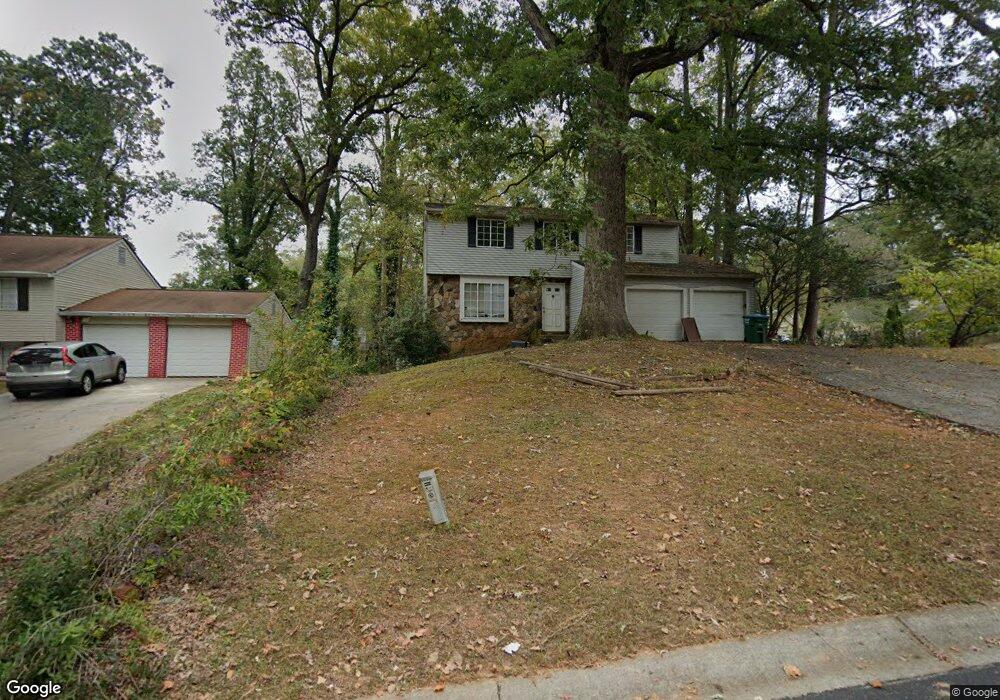
2201 Tahoe Ct Norcross, GA 30071
Estimated Value: $297,000 - $354,079
4
Beds
3
Baths
1,794
Sq Ft
$184/Sq Ft
Est. Value
About This Home
This home is located at 2201 Tahoe Ct, Norcross, GA 30071 and is currently estimated at $329,520, approximately $183 per square foot. 2201 Tahoe Ct is a home located in Gwinnett County with nearby schools including Beaver Ridge Elementary School, Summerour Middle School, and Norcross High School.
Ownership History
Date
Name
Owned For
Owner Type
Purchase Details
Closed on
Oct 2, 2009
Sold by
Federal Natl Mtg Assn Fnma
Bought by
Nasrallah Ram
Current Estimated Value
Home Financials for this Owner
Home Financials are based on the most recent Mortgage that was taken out on this home.
Original Mortgage
$82,417
Outstanding Balance
$53,434
Interest Rate
5.1%
Mortgage Type
FHA
Estimated Equity
$276,086
Purchase Details
Closed on
Jul 7, 2009
Sold by
First Horizon Home Loans
Bought by
Federal National Mortgage Association
Purchase Details
Closed on
Oct 5, 2004
Sold by
Impello Ronald J
Bought by
Llamas Angel
Home Financials for this Owner
Home Financials are based on the most recent Mortgage that was taken out on this home.
Original Mortgage
$153,000
Interest Rate
5.71%
Mortgage Type
New Conventional
Purchase Details
Closed on
Feb 18, 2000
Sold by
Kladitis Steven M
Bought by
Impello Ronald J
Create a Home Valuation Report for This Property
The Home Valuation Report is an in-depth analysis detailing your home's value as well as a comparison with similar homes in the area
Home Values in the Area
Average Home Value in this Area
Purchase History
| Date | Buyer | Sale Price | Title Company |
|---|---|---|---|
| Nasrallah Ram | -- | -- | |
| Federal National Mortgage Association | -- | -- | |
| First Horizon Home Loans | $120,297 | -- | |
| Llamas Angel | $153,000 | -- | |
| Impello Ronald J | $118,000 | -- |
Source: Public Records
Mortgage History
| Date | Status | Borrower | Loan Amount |
|---|---|---|---|
| Open | Nasrallah Ram | $82,417 | |
| Previous Owner | Llamas Angel | $153,000 |
Source: Public Records
Tax History Compared to Growth
Tax History
| Year | Tax Paid | Tax Assessment Tax Assessment Total Assessment is a certain percentage of the fair market value that is determined by local assessors to be the total taxable value of land and additions on the property. | Land | Improvement |
|---|---|---|---|---|
| 2025 | $3,795 | $143,200 | $25,840 | $117,360 |
| 2024 | $3,593 | $127,280 | $24,400 | $102,880 |
| 2023 | $3,593 | $121,800 | $24,400 | $97,400 |
| 2022 | $3,072 | $103,840 | $18,000 | $85,840 |
| 2021 | $1,805 | $47,000 | $10,000 | $37,000 |
| 2020 | $1,814 | $47,000 | $10,000 | $37,000 |
| 2019 | $1,755 | $47,000 | $10,000 | $37,000 |
| 2018 | $1,750 | $47,000 | $10,000 | $37,000 |
| 2016 | $1,113 | $28,160 | $4,000 | $24,160 |
| 2015 | $1,119 | $28,160 | $4,000 | $24,160 |
| 2014 | $1,122 | $28,160 | $4,000 | $24,160 |
Source: Public Records
Map
Nearby Homes
- 5106 Rockborough Trail
- 4935 Rockborough Trail
- 5065 Rockborough Trail NW
- 5041 Rockborough Trail Unit 3
- 4242 Morrison Lake Trail
- 5055 Running Fox Trail
- 2325 E Hill Way NW
- 2066 Pinnacle Pointe Dr
- 2037 Pinnacle Pointe Dr
- 101 Vineyard Pond Dr NW
- 2340 Beaver Ruin Rd Unit 26
- 2340 Beaver Ruin Rd Unit 41
- 2340 Beaver Ruin Rd
- 2340 Beaver Ruin Rd Unit 15
- 2340 Beaver Ruin Rd Unit 16
- 5045 Racquet Ct
- 5341 Goodwick Way
- 4960 Racquet Ct
- 2621 Bailey Dr
- 5206 Westhill Dr NW
- 5131 Rockborough Trail
- 5131 Rockborough Trail NW
- 2207 Tahoe Ct
- 5138 Rockborough Trail
- 2213 Tahoe Ct
- 5132 Rockborough Trail
- 5137 Rockborough Trail
- 5144 Rockborough Trail
- 2120 Shadow Ct
- 2114 Shadow Ct
- 2212 Tahoe Ct
- 5126 Rockborough Trail
- 2126 Shadow Ct
- 2104 Shadow Ct
- 5150 Rockborough Trail
- 5143 Rockborough Trail
- 2132 Shadow Ct
- 5120 Rockborough Trail Unit 2
- 2219 Tahoe Ct Unit 2
- 5156 Rockborough Trail