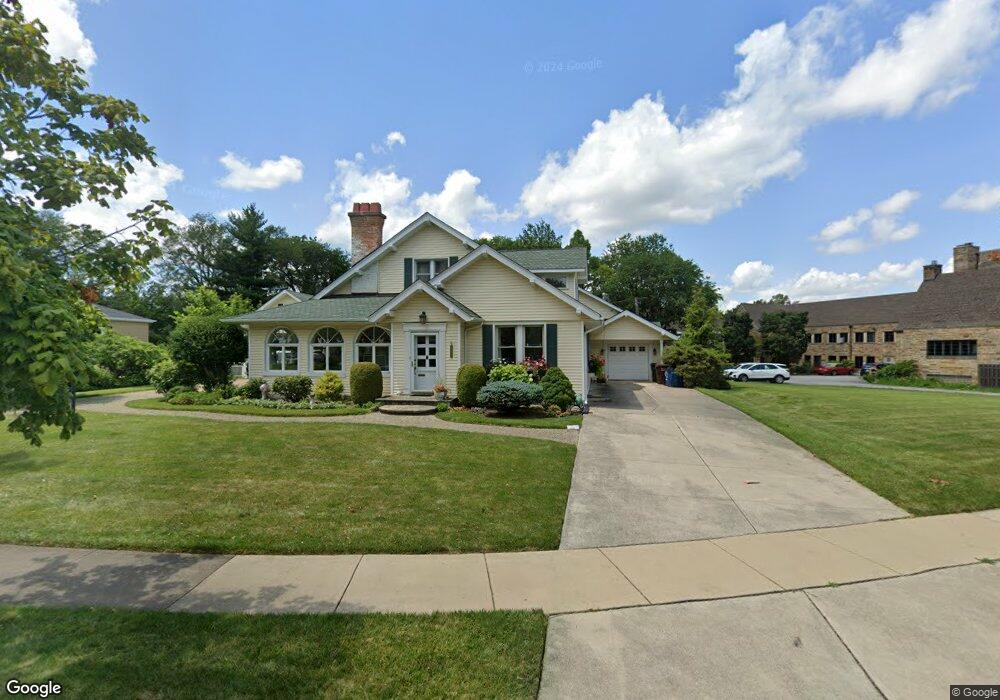
2201 Travers Ln Flossmoor, IL 60422
Estimated Value: $498,750 - $610,000
4
Beds
2
Baths
3,188
Sq Ft
$174/Sq Ft
Est. Value
About This Home
This home is located at 2201 Travers Ln, Flossmoor, IL 60422 and is currently estimated at $554,438, approximately $173 per square foot. 2201 Travers Ln is a home located in Cook County with nearby schools including Western Avenue Elementary School, Parker Junior High School, and Homewood-Flossmoor High School.
Ownership History
Date
Name
Owned For
Owner Type
Purchase Details
Closed on
Dec 9, 2024
Sold by
Bertram Jack M
Bought by
Jack M Bertram And Family Trust and Bertram
Current Estimated Value
Purchase Details
Closed on
Mar 31, 1998
Sold by
Byers Joseph and Swanson Byers Darla J
Bought by
Bertram Jack M and Bertram Susan D
Home Financials for this Owner
Home Financials are based on the most recent Mortgage that was taken out on this home.
Original Mortgage
$196,150
Interest Rate
7.27%
Purchase Details
Closed on
Sep 12, 1996
Sold by
Flossmoor Community Church
Bought by
Byers Joseph and Swanson Byers Darla J
Home Financials for this Owner
Home Financials are based on the most recent Mortgage that was taken out on this home.
Original Mortgage
$120,000
Interest Rate
7.93%
Create a Home Valuation Report for This Property
The Home Valuation Report is an in-depth analysis detailing your home's value as well as a comparison with similar homes in the area
Home Values in the Area
Average Home Value in this Area
Purchase History
| Date | Buyer | Sale Price | Title Company |
|---|---|---|---|
| Jack M Bertram And Family Trust | -- | None Listed On Document | |
| Bertram Jack M | $210,000 | -- | |
| Byers Joseph | -- | Attorneys Natl Title Network |
Source: Public Records
Mortgage History
| Date | Status | Borrower | Loan Amount |
|---|---|---|---|
| Previous Owner | Bertram Jack M | $196,150 | |
| Previous Owner | Byers Joseph | $120,000 |
Source: Public Records
Tax History Compared to Growth
Tax History
| Year | Tax Paid | Tax Assessment Tax Assessment Total Assessment is a certain percentage of the fair market value that is determined by local assessors to be the total taxable value of land and additions on the property. | Land | Improvement |
|---|---|---|---|---|
| 2024 | $14,345 | $37,001 | $9,070 | $27,931 |
| 2023 | $13,142 | $37,001 | $9,070 | $27,931 |
| 2022 | $13,142 | $27,877 | $7,709 | $20,168 |
| 2021 | $13,190 | $27,876 | $7,709 | $20,167 |
| 2020 | $12,756 | $27,876 | $7,709 | $20,167 |
| 2019 | $13,970 | $29,438 | $6,802 | $22,636 |
| 2018 | $13,436 | $29,438 | $6,802 | $22,636 |
| 2017 | $13,226 | $29,438 | $6,802 | $22,636 |
| 2016 | $10,584 | $22,551 | $6,348 | $16,203 |
| 2015 | $10,567 | $22,551 | $6,348 | $16,203 |
| 2014 | $10,390 | $22,551 | $6,348 | $16,203 |
| 2013 | $11,431 | $26,681 | $6,348 | $20,333 |
Source: Public Records
Map
Nearby Homes
- 950 Gardner Rd
- 830 Latimer Ln
- 2039 Marston Ln
- 2007 Amherst Ct
- 2045 Downey Rd
- 18646 Palmer Cir
- 18652 Martin Ave
- 18646 Martin Ave
- 802 Argyle Ave
- 1834 Terrace Rd
- 1821 Terrace Rd
- 2622 Central Dr Unit 2N
- 625 Perth Ave
- 1832 187th St
- 2640 Central Dr Unit 1-N
- 18526 Dixie Hwy
- 1822 W 187th St
- 2633 Hawthorne Ln Unit B
- 1117 Leavitt Ave Unit 110
- 1418 Western Ave
- 2207 Travers Ln
- 2226 Carroll Pkwy
- 2143 Hagen Ln
- 2200 Travers Ln
- 2200 Travers Ln
- 2232 Carroll Pkwy
- 2210 Travers Ln
- 2219 Travers Ln
- 2135 Hagen Ln
- 933 Travers Ln
- 2238 Carroll Pkwy
- 2136 Hagen Ln Unit 1
- 2205 Evans Rd
- 2149 Evans Rd
- 2223 Travers Ln
- 2220 Travers Ln
- 2125 Hagen Ln
- 2130 Hutchison Rd
- 2240 Carroll Pkwy
- 2227 Carroll Pkwy