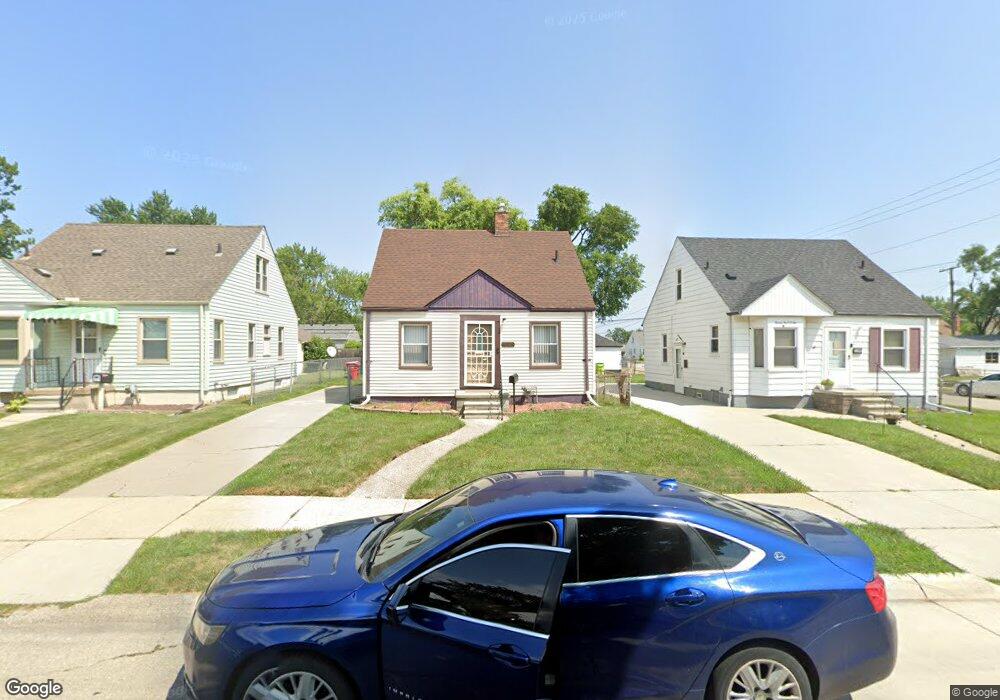
22010 Gascony Ave Eastpointe, MI 48021
Estimated Value: $114,103 - $134,000
2
Beds
1
Bath
852
Sq Ft
$147/Sq Ft
Est. Value
About This Home
This home is located at 22010 Gascony Ave, Eastpointe, MI 48021 and is currently estimated at $125,276, approximately $147 per square foot. 22010 Gascony Ave is a home located in Macomb County with nearby schools including Pleasantview Elementary School, Eastpointe Middle School, and Eaton Academy.
Ownership History
Date
Name
Owned For
Owner Type
Purchase Details
Closed on
May 28, 2010
Sold by
Millennium Financial Management
Bought by
Davidson Thomina
Current Estimated Value
Purchase Details
Closed on
Feb 8, 2010
Sold by
Mvb Mortgage Corporation
Bought by
Davidson Thomina and Millennium Financial Managemen
Purchase Details
Closed on
Jan 15, 2010
Sold by
Johnson Traci D
Bought by
Mvb Mortgage Corporation
Purchase Details
Closed on
Jun 21, 2006
Sold by
Hud
Bought by
Johnson Traci D
Purchase Details
Closed on
Jul 29, 2005
Sold by
Mortgage Electronic Registration Systems
Bought by
Hud
Purchase Details
Closed on
Jan 7, 2005
Sold by
Clark Kenneth M
Bought by
Mortgage Electronic Registration Systems
Purchase Details
Closed on
Aug 25, 2000
Sold by
Garden Investments Inc
Bought by
Clark Kenneth M
Home Financials for this Owner
Home Financials are based on the most recent Mortgage that was taken out on this home.
Original Mortgage
$74,844
Interest Rate
7.87%
Create a Home Valuation Report for This Property
The Home Valuation Report is an in-depth analysis detailing your home's value as well as a comparison with similar homes in the area
Home Values in the Area
Average Home Value in this Area
Purchase History
| Date | Buyer | Sale Price | Title Company |
|---|---|---|---|
| Davidson Thomina | $3,000 | None Available | |
| Davidson Thomina | $3,000 | None Available | |
| Mvb Mortgage Corporation | $5,000 | None Available | |
| Johnson Traci D | $48,000 | None Available | |
| Hud | -- | -- | |
| Mortgage Electronic Registration Systems | $90,751 | -- | |
| Clark Kenneth M | $75,000 | -- |
Source: Public Records
Mortgage History
| Date | Status | Borrower | Loan Amount |
|---|---|---|---|
| Previous Owner | Clark Kenneth M | $74,844 |
Source: Public Records
Tax History Compared to Growth
Tax History
| Year | Tax Paid | Tax Assessment Tax Assessment Total Assessment is a certain percentage of the fair market value that is determined by local assessors to be the total taxable value of land and additions on the property. | Land | Improvement |
|---|---|---|---|---|
| 2025 | $2,552 | $42,900 | $0 | $0 |
| 2024 | $1,876 | $42,000 | $0 | $0 |
| 2023 | $1,689 | $33,700 | $0 | $0 |
| 2022 | $1,239 | $28,400 | $0 | $0 |
| 2021 | $2,414 | $26,200 | $0 | $0 |
| 2020 | $1,047 | $23,500 | $0 | $0 |
| 2019 | $1,894 | $21,100 | $0 | $0 |
| 2018 | $1,526 | $20,000 | $0 | $0 |
| 2017 | $1,526 | $17,920 | $3,020 | $14,900 |
| 2016 | $1,698 | $17,920 | $0 | $0 |
| 2015 | $827 | $15,420 | $0 | $0 |
| 2013 | $1,154 | $14,820 | $0 | $0 |
Source: Public Records
Map
Nearby Homes
- 21803 Brittany Ave
- 22036 Tuscany Ave
- 21751 Normandy Ave
- 21772 Normandy Ave
- 21785 Tuscany Ave
- 21746 Lambrecht Ave
- 22139 Normandy Ave
- 17728 Toepfer Dr
- 17725 Lincoln Ave
- 22095 Wilmot Ave
- 22015 Saxony Ave
- 21700 Wilmot Ave
- 22441 Gascony Ave
- 17362 Toepfer Dr
- 22432 Lambrecht Ave
- 21706 Rausch Ave
- 21474 Kelly Rd
- 17304 Lincoln Ave
- 22095 Rausch Ave
- 22404 Rausch Ave
- 22002 Gascony Ave
- 22018 Gascony Ave
- 22034 Gascony Ave
- 22015 Brittany Ave
- 22005 Brittany Ave
- 22025 Brittany Ave
- 21858 Gascony Ave
- 22042 Gascony Ave
- 22011 Gascony Ave
- 22021 Gascony Ave
- 22003 Gascony Ave
- 21850 Gascony Ave
- 22035 Gascony Ave
- 22029 Gascony Ave
- 21861 Brittany Ave
- 22035 Brittany Ave
- 22050 Gascony Ave
- 22049 Brittany Ave
- 21851 Brittany Ave
- 21859 Gascony Ave