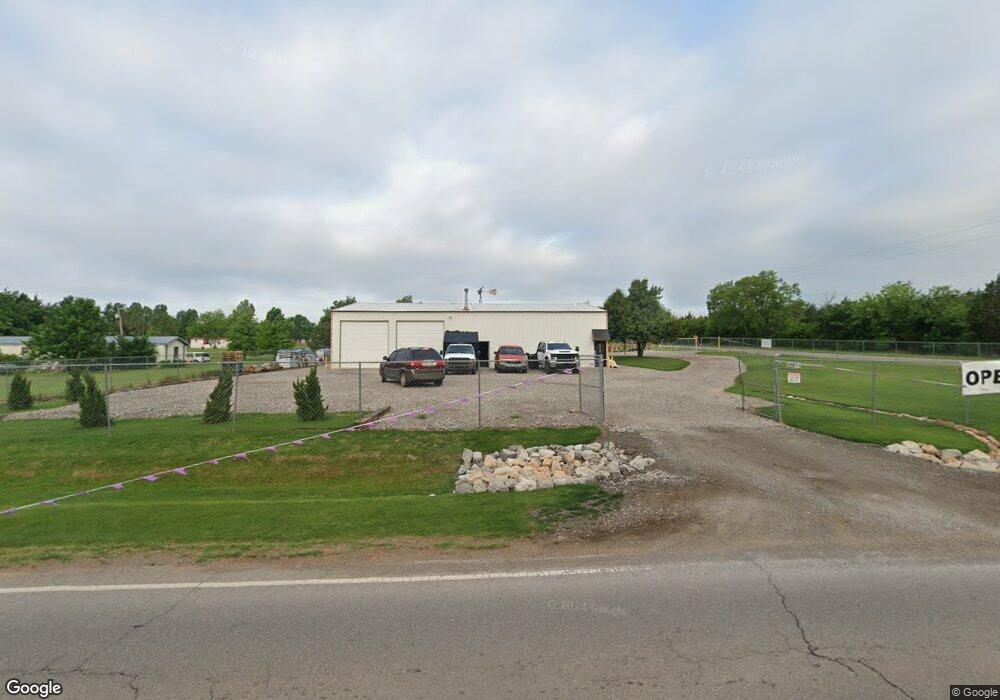
22011 N Western Ave Edmond, OK 73012
West Edmond NeighborhoodEstimated Value: $148,842 - $252,000
--
Bed
--
Bath
1
Sq Ft
$202,711/Sq Ft
Est. Value
About This Home
This home is located at 22011 N Western Ave, Edmond, OK 73012 and is currently estimated at $202,711, approximately $202,711 per square foot. 22011 N Western Ave is a home with nearby schools including Prairie Vale Elementary School, Deer Creek Middle School, and Deer Creek Intermediate School.
Ownership History
Date
Name
Owned For
Owner Type
Purchase Details
Closed on
Dec 15, 2016
Sold by
22011 N Western Ave Llc
Bought by
22011 N Western Ave Llc
Current Estimated Value
Purchase Details
Closed on
Jul 2, 2009
Sold by
Ramsey Charles M and Ramsey Tammy
Bought by
22011 N Western Ave Llc
Purchase Details
Closed on
Aug 20, 2008
Sold by
Littleton Robert and Littleton Annette
Bought by
Ramsey Charles M and Ramsey Tammy
Purchase Details
Closed on
Jul 25, 2005
Sold by
Crosby Sam and Crosby Marcia
Bought by
Littleton Robert and Littleton Armette
Purchase Details
Closed on
Jan 22, 2004
Sold by
Smith Jack Ray and Smith Virginia Lynn
Bought by
Crosby Sam and Crosby Marcia
Purchase Details
Closed on
Jan 9, 2004
Sold by
Sprouse Kenneth and Sprouse Bea
Bought by
Crosby Sam and Crosby Marcia
Purchase Details
Closed on
Oct 9, 1995
Sold by
Adams Shannon
Bought by
Crosby Sam and Crosby Marcia
Create a Home Valuation Report for This Property
The Home Valuation Report is an in-depth analysis detailing your home's value as well as a comparison with similar homes in the area
Home Values in the Area
Average Home Value in this Area
Purchase History
| Date | Buyer | Sale Price | Title Company |
|---|---|---|---|
| 22011 N Western Ave Llc | -- | None Available | |
| 22011 N Western Ave Llc | $140,000 | Oklahoma Title & Closing Co | |
| Ramsey Charles M | $39,000 | The Oklahoma City Abstract & | |
| Littleton Robert | -- | -- | |
| Crosby Sam | -- | -- | |
| Crosby Sam | -- | -- | |
| Crosby Sam | -- | -- |
Source: Public Records
Tax History Compared to Growth
Tax History
| Year | Tax Paid | Tax Assessment Tax Assessment Total Assessment is a certain percentage of the fair market value that is determined by local assessors to be the total taxable value of land and additions on the property. | Land | Improvement |
|---|---|---|---|---|
| 2024 | $549 | $4,645 | $2,708 | $1,937 |
| 2023 | $549 | $4,424 | $2,572 | $1,852 |
| 2022 | $484 | $4,213 | $2,443 | $1,770 |
| 2021 | $453 | $4,013 | $2,230 | $1,783 |
| 2020 | $476 | $3,822 | $2,442 | $1,380 |
| 2019 | $28 | $3,874 | $2,443 | $1,431 |
| 2018 | $28 | $3,872 | $0 | $0 |
| 2017 | $27 | $3,688 | $2,442 | $1,246 |
| 2016 | $442 | $3,516 | $2,200 | $1,316 |
| 2015 | $414 | $3,586 | $2,200 | $1,386 |
| 2014 | $426 | $3,657 | $2,200 | $1,457 |
Source: Public Records
Map
Nearby Homes
- 21900 N Douglas Ave
- 3701 Lynne Ave
- 3725 Lynne Ave
- 3709 Lynne Ave
- 3717 Lynne Ave
- 3340 Cookson Point Dr
- 3332 Cookson Point Dr
- 3716 Lynne Ave
- 3708 Lynne Ave
- 3724 Lynne Ave
- 3800 Lynne Ave
- 3808 Lynne Ave
- 3816 Lynne Ave
- 3316 Cookson Point Dr
- 3824 Lynne Ave
- 1701 Birchfield Rd
- 3325 Poppey Ln
- 3317 Welling Rd
- 3300 Porter Dr
- 3324 Courtney Creek Dr
- 22007 Military Ave
- 22001 Military Ave
- 22014 Douglas Ave
- 22008 N Douglas Ave
- 1280 NW 220th St
- 21690 Military Ave
- 21818 N Douglas Ave
- 21955 Douglas Ave
- 21812 N Douglas Ave
- 21686 Military Ave
- 22050 N Horseshoe Rd
- 21950 N Horseshoe Rd
- 21780 Douglas Ave
- 21850 N Horseshoe Rd
- 21750 N Horseshoe Rd
- 22051 N Horseshoe Rd
- 21951 N Horseshoe Rd
- 21851 N Horseshoe Rd
- 21700 N Horseshoe Rd
- 21751 N Horseshoe Rd