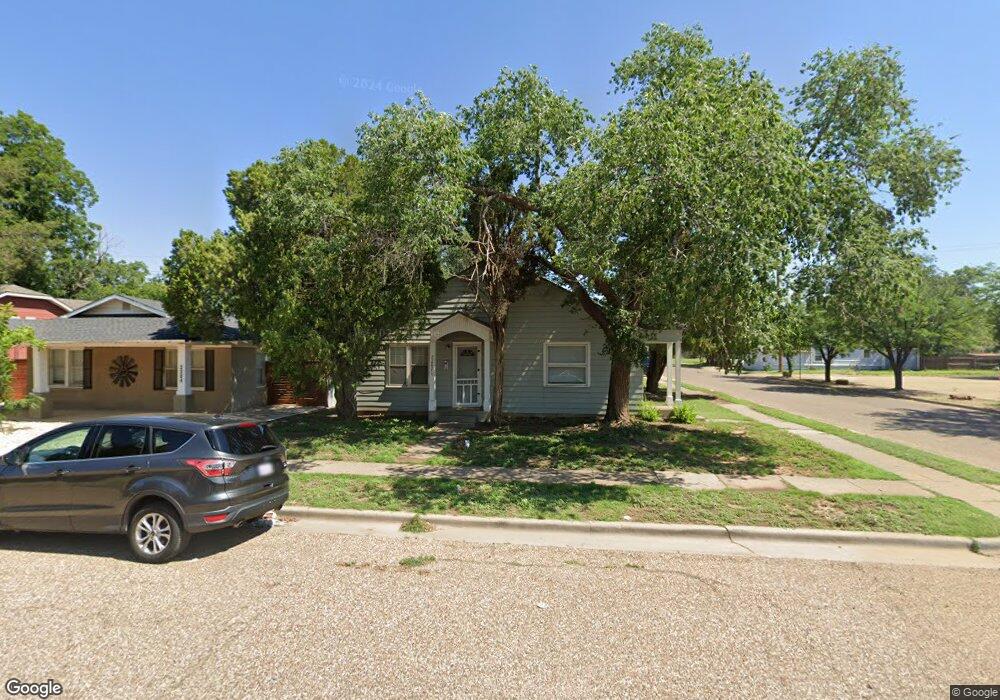
2202 18th St Unit B Lubbock, TX 79401
South Overton NeighborhoodEstimated Value: $130,000 - $194,635
1
Bed
1
Bath
752
Sq Ft
$219/Sq Ft
Est. Value
About This Home
This home is located at 2202 18th St Unit B, Lubbock, TX 79401 and is currently estimated at $164,409, approximately $218 per square foot. 2202 18th St Unit B is a home located in Lubbock County with nearby schools including Ramirez Elementary School, Hutchinson Middle School, and Lubbock High School.
Ownership History
Date
Name
Owned For
Owner Type
Purchase Details
Closed on
Feb 11, 2026
Sold by
Browder Terry
Bought by
Lonestar Capital Assets Inc
Current Estimated Value
Purchase Details
Closed on
Sep 14, 2023
Sold by
Gaston Park Properties Llc
Bought by
Hobbit Window Holdings Llc
Home Financials for this Owner
Home Financials are based on the most recent Mortgage that was taken out on this home.
Original Mortgage
$120,000
Interest Rate
6.9%
Mortgage Type
New Conventional
Purchase Details
Closed on
Nov 19, 2012
Sold by
Mcmurty E H
Bought by
Gaston Park Properties Llc
Create a Home Valuation Report for This Property
The Home Valuation Report is an in-depth analysis detailing your home's value as well as a comparison with similar homes in the area
Home Values in the Area
Average Home Value in this Area
Purchase History
| Date | Buyer | Sale Price | Title Company |
|---|---|---|---|
| Lonestar Capital Assets Inc | $115,001 | None Listed On Document | |
| Hobbit Window Holdings Llc | -- | None Listed On Document | |
| Gaston Park Properties Llc | -- | -- |
Source: Public Records
Mortgage History
| Date | Status | Borrower | Loan Amount |
|---|---|---|---|
| Previous Owner | Hobbit Window Holdings Llc | $120,000 |
Source: Public Records
Tax History
| Year | Tax Paid | Tax Assessment Tax Assessment Total Assessment is a certain percentage of the fair market value that is determined by local assessors to be the total taxable value of land and additions on the property. | Land | Improvement |
|---|---|---|---|---|
| 2025 | $3,544 | $195,154 | $21,000 | $174,154 |
| 2024 | $3,544 | $195,154 | $21,000 | $174,154 |
| 2023 | $3,057 | $164,433 | $2,000 | $162,433 |
| 2022 | $2,905 | $143,501 | $2,000 | $141,501 |
| 2021 | $2,439 | $113,892 | $2,000 | $111,892 |
| 2020 | $2,477 | $113,892 | $2,000 | $111,892 |
| 2019 | $2,369 | $105,518 | $2,000 | $103,518 |
| 2018 | $1,851 | $82,354 | $2,000 | $80,354 |
| 2017 | $1,854 | $82,354 | $2,000 | $80,354 |
| 2016 | $1,910 | $84,862 | $2,000 | $82,862 |
| 2015 | $1,696 | $79,337 | $2,000 | $77,337 |
| 2014 | $1,696 | $76,290 | $2,000 | $74,290 |
Source: Public Records
Map
Nearby Homes
Your Personal Tour Guide
Ask me questions while you tour the home.