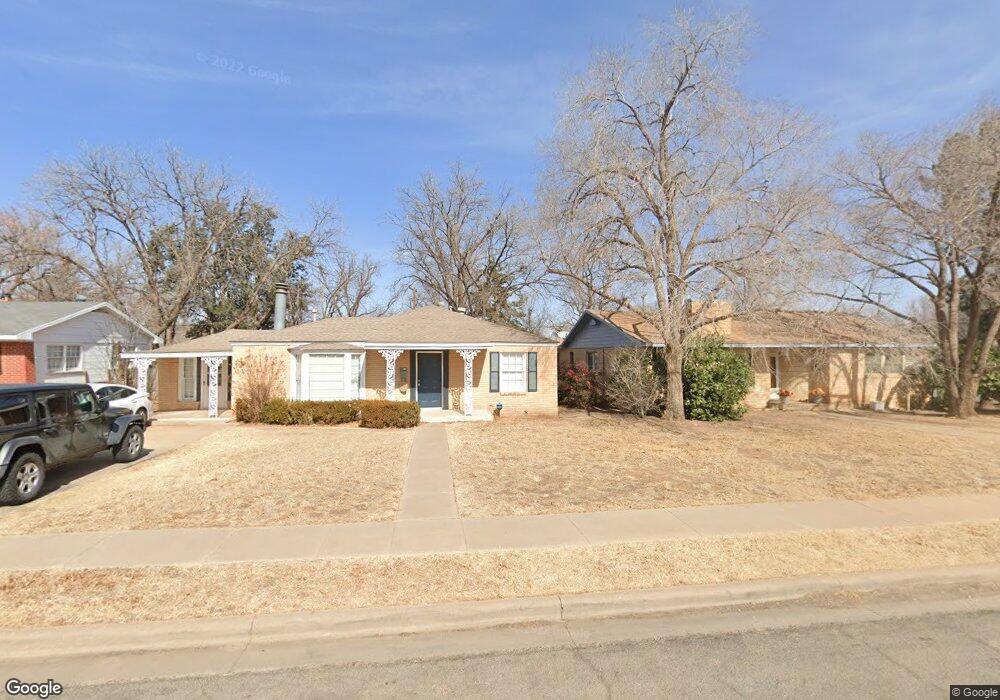
2202 31st St Lubbock, TX 79411
Heart of Lubbock NeighborhoodEstimated Value: $148,000 - $158,000
3
Beds
2
Baths
1,628
Sq Ft
$94/Sq Ft
Est. Value
About This Home
This home is located at 2202 31st St, Lubbock, TX 79411 and is currently estimated at $152,673, approximately $93 per square foot. 2202 31st St is a home located in Lubbock County with nearby schools including Brown Elementary School, Dupre Elementary School, and Slaton Middle School.
Ownership History
Date
Name
Owned For
Owner Type
Purchase Details
Closed on
Jan 20, 2023
Sold by
Hartman Roby
Bought by
Gc28 Holdings Llc
Current Estimated Value
Purchase Details
Closed on
Jan 18, 2023
Sold by
Gc28 Holdings Llc
Bought by
T & D Real Estate And Rentals Llc
Purchase Details
Closed on
May 8, 2017
Sold by
Kennimer Jackie D and Hogan Mona E
Bought by
Hartman Roby and Derstine Debra
Create a Home Valuation Report for This Property
The Home Valuation Report is an in-depth analysis detailing your home's value as well as a comparison with similar homes in the area
Home Values in the Area
Average Home Value in this Area
Purchase History
| Date | Buyer | Sale Price | Title Company |
|---|---|---|---|
| Gc28 Holdings Llc | -- | Service Title | |
| T & D Real Estate And Rentals Llc | -- | Service Title | |
| Hartman Roby | -- | Service Title |
Source: Public Records
Tax History Compared to Growth
Tax History
| Year | Tax Paid | Tax Assessment Tax Assessment Total Assessment is a certain percentage of the fair market value that is determined by local assessors to be the total taxable value of land and additions on the property. | Land | Improvement |
|---|---|---|---|---|
| 2025 | $1,997 | $110,000 | $10,500 | $99,500 |
| 2024 | $1,997 | $110,000 | $10,500 | $99,500 |
| 2023 | $3,173 | $170,698 | $10,500 | $160,198 |
| 2022 | $2,830 | $139,782 | $10,500 | $129,282 |
| 2021 | $2,724 | $127,179 | $10,500 | $116,679 |
| 2020 | $2,414 | $110,996 | $10,500 | $100,496 |
| 2019 | $2,224 | $99,073 | $10,500 | $88,573 |
| 2018 | $2,016 | $89,705 | $10,500 | $79,205 |
| 2017 | $2,106 | $93,576 | $3,300 | $90,276 |
| 2016 | $2,106 | $93,576 | $3,300 | $90,276 |
| 2015 | $991 | $92,249 | $3,300 | $88,949 |
| 2014 | $991 | $85,561 | $3,300 | $82,261 |
Source: Public Records
Map
Nearby Homes