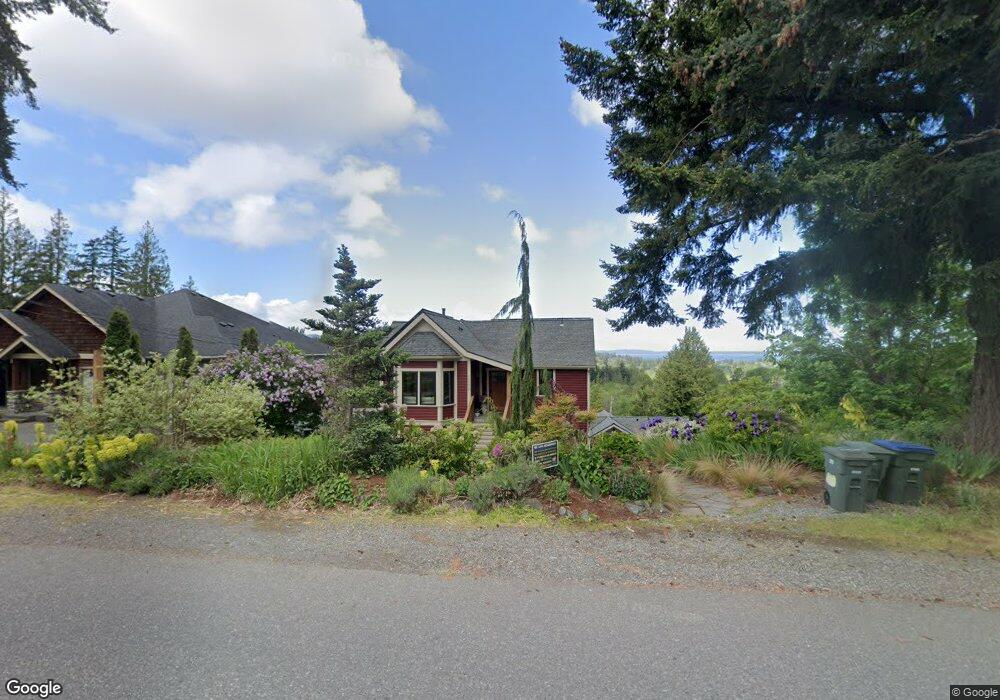
2202 36th St Bellingham, WA 98229
Samish NeighborhoodEstimated Value: $941,000 - $1,147,000
2
Beds
1
Bath
2,563
Sq Ft
$416/Sq Ft
Est. Value
About This Home
This home is located at 2202 36th St, Bellingham, WA 98229 and is currently estimated at $1,067,172, approximately $416 per square foot. 2202 36th St is a home located in Whatcom County with nearby schools including Happy Valley Elementary School, Fairhaven Middle School, and Sehome High School.
Ownership History
Date
Name
Owned For
Owner Type
Purchase Details
Closed on
Jun 9, 2020
Sold by
Brogan David T
Bought by
Brogan David T and Schuster Kimberly B
Current Estimated Value
Home Financials for this Owner
Home Financials are based on the most recent Mortgage that was taken out on this home.
Original Mortgage
$420,000
Outstanding Balance
$372,298
Interest Rate
3.2%
Mortgage Type
New Conventional
Estimated Equity
$694,874
Purchase Details
Closed on
Nov 12, 2001
Sold by
Bochat Heritage Homes Inc
Bought by
Brogan David T
Home Financials for this Owner
Home Financials are based on the most recent Mortgage that was taken out on this home.
Original Mortgage
$141,075
Interest Rate
5.37%
Purchase Details
Closed on
Jul 30, 2001
Sold by
Giordano Nancy B
Bought by
Bochat Heritage Homes Inc
Home Financials for this Owner
Home Financials are based on the most recent Mortgage that was taken out on this home.
Original Mortgage
$106,500
Interest Rate
7.15%
Purchase Details
Closed on
Sep 19, 2000
Sold by
Kohl Construction Inc
Bought by
Giordano Nancy B
Create a Home Valuation Report for This Property
The Home Valuation Report is an in-depth analysis detailing your home's value as well as a comparison with similar homes in the area
Home Values in the Area
Average Home Value in this Area
Purchase History
| Date | Buyer | Sale Price | Title Company |
|---|---|---|---|
| Brogan David T | -- | Whatcom Land Title | |
| Brogan David T | $126,500 | Whatcom Land Title | |
| Bochat Heritage Homes Inc | $105,000 | First American Title Insuran | |
| Giordano Nancy B | -- | Chicago Title Insurance |
Source: Public Records
Mortgage History
| Date | Status | Borrower | Loan Amount |
|---|---|---|---|
| Open | Brogan David T | $420,000 | |
| Closed | Brogan David T | $141,075 | |
| Previous Owner | Bochat Heritage Homes Inc | $106,500 |
Source: Public Records
Tax History Compared to Growth
Tax History
| Year | Tax Paid | Tax Assessment Tax Assessment Total Assessment is a certain percentage of the fair market value that is determined by local assessors to be the total taxable value of land and additions on the property. | Land | Improvement |
|---|---|---|---|---|
| 2024 | $8,135 | $1,009,513 | $371,668 | $637,845 |
| 2023 | $8,135 | $1,045,605 | $384,956 | $660,649 |
| 2022 | $5,845 | $872,011 | $327,624 | $544,387 |
| 2021 | $5,433 | $629,284 | $264,220 | $365,064 |
| 2020 | $5,335 | $551,999 | $231,770 | $320,229 |
| 2019 | $5,070 | $523,967 | $220,000 | $303,967 |
| 2018 | $5,264 | $499,264 | $217,217 | $282,047 |
| 2017 | $4,638 | $443,167 | $192,808 | $250,359 |
| 2016 | $4,225 | $408,085 | $177,408 | $230,677 |
| 2015 | $4,159 | $387,035 | $168,168 | $218,867 |
| 2014 | -- | $368,596 | $160,160 | $208,436 |
| 2013 | -- | $350,823 | $154,000 | $196,823 |
Source: Public Records
Map
Nearby Homes
- 2500 Samish Way Unit 50
- 2500 Samish Way Unit 13
- 1615 Samish Way
- 4203 Harrison St
- 3104 Wilson Ave
- 1800 40th Place
- 2604 S 42nd St
- 2608 S 42nd St
- 2815 Willis St
- 2600 42nd
- 2010 Samish Crest Way
- 3605 Mill Ave
- 2015 24th St Unit 31
- 3204 30th St
- 2694 Donovan Ave Unit 32
- 1758 Old Samish Rd
- 2100 Lindsay Ave
- 2400 Donovan Ave Unit 13
- 1000 Samish Way
- 835 Samish Way