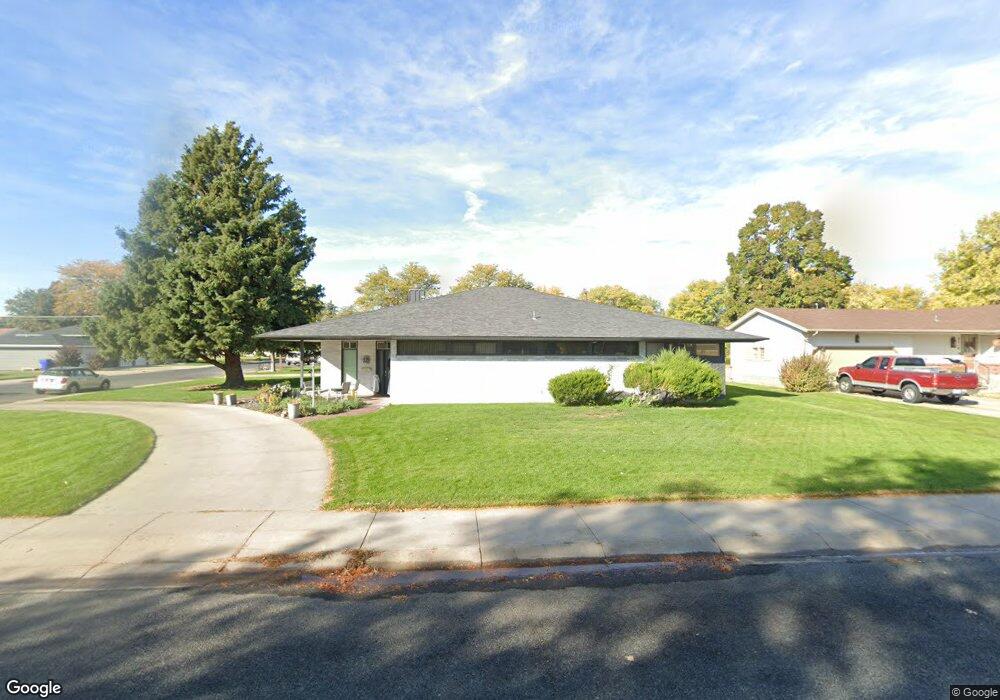
2202 7th Ave Scottsbluff, NE 69361
Estimated Value: $337,000 - $425,000
3
Beds
5
Baths
2,088
Sq Ft
$179/Sq Ft
Est. Value
About This Home
This home is located at 2202 7th Ave, Scottsbluff, NE 69361 and is currently estimated at $373,837, approximately $179 per square foot. 2202 7th Ave is a home located in Scotts Bluff County with nearby schools including Longfellow Elementary School, Bluffs Middle School, and Scottsbluff Senior High School.
Ownership History
Date
Name
Owned For
Owner Type
Purchase Details
Closed on
Aug 6, 2013
Sold by
Massey James D
Bought by
Larson Chad and Larson Kell
Current Estimated Value
Home Financials for this Owner
Home Financials are based on the most recent Mortgage that was taken out on this home.
Original Mortgage
$245,471
Outstanding Balance
$175,621
Interest Rate
3.62%
Mortgage Type
FHA
Estimated Equity
$198,216
Create a Home Valuation Report for This Property
The Home Valuation Report is an in-depth analysis detailing your home's value as well as a comparison with similar homes in the area
Home Values in the Area
Average Home Value in this Area
Purchase History
| Date | Buyer | Sale Price | Title Company |
|---|---|---|---|
| Larson Chad | $250,000 | None Available |
Source: Public Records
Mortgage History
| Date | Status | Borrower | Loan Amount |
|---|---|---|---|
| Open | Larson Chad | $245,471 |
Source: Public Records
Tax History
| Year | Tax Paid | Tax Assessment Tax Assessment Total Assessment is a certain percentage of the fair market value that is determined by local assessors to be the total taxable value of land and additions on the property. | Land | Improvement |
|---|---|---|---|---|
| 2025 | $4,608 | $382,260 | $26,215 | $356,045 |
| 2024 | $4,595 | $365,305 | $26,215 | $339,090 |
| 2023 | $5,888 | $290,755 | $25,117 | $265,638 |
| 2022 | $5,888 | $290,755 | $25,117 | $265,638 |
| 2021 | $5,480 | $266,606 | $25,117 | $241,489 |
| 2020 | $5,321 | $257,318 | $25,117 | $232,201 |
| 2019 | $5,174 | $250,555 | $25,117 | $225,438 |
| 2018 | $5,206 | $250,555 | $25,117 | $225,438 |
| 2017 | $5,224 | $250,555 | $25,117 | $225,438 |
| 2016 | $5,230 | $250,555 | $25,117 | $225,438 |
| 2015 | $4,767 | $230,061 | $25,117 | $204,944 |
| 2014 | $4,458 | $230,061 | $25,117 | $204,944 |
| 2012 | -- | $230,061 | $25,117 | $204,944 |
Source: Public Records
Map
Nearby Homes
Your Personal Tour Guide
Ask me questions while you tour the home.