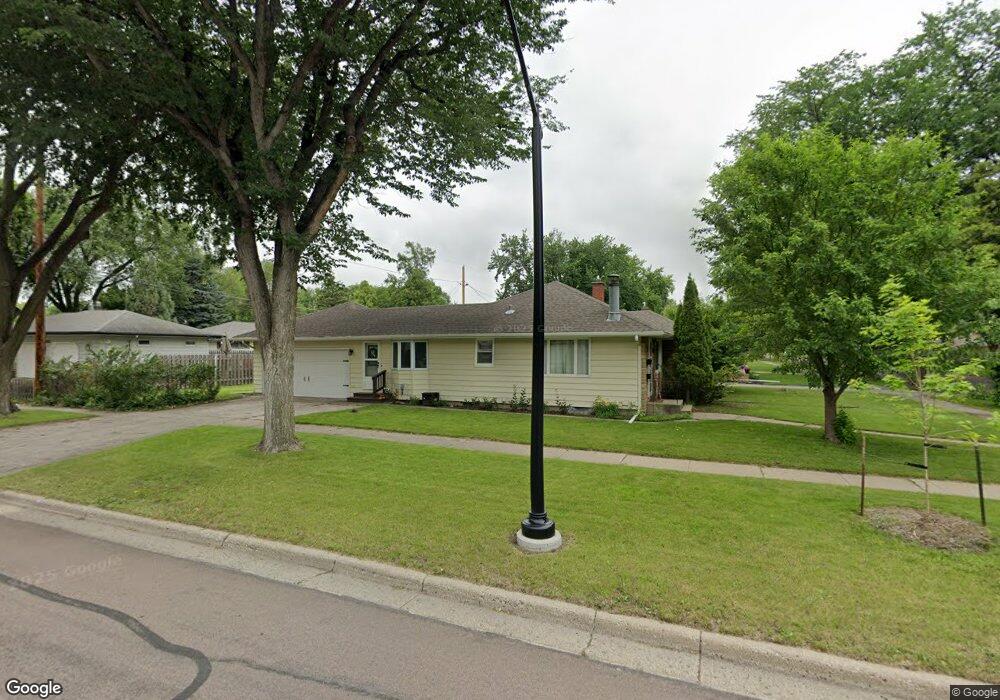
2202 9th St N Fargo, ND 58102
Northport NeighborhoodEstimated Value: $274,000 - $315,000
3
Beds
2
Baths
2,520
Sq Ft
$117/Sq Ft
Est. Value
About This Home
This home is located at 2202 9th St N, Fargo, ND 58102 and is currently estimated at $294,493, approximately $116 per square foot. 2202 9th St N is a home located in Cass County with nearby schools including Washington Elementary School, Ben Franklin Middle School, and North High School.
Ownership History
Date
Name
Owned For
Owner Type
Purchase Details
Closed on
Jun 18, 2021
Sold by
Johnson Connor B and Johnson Rachel A
Bought by
Rommesmo Katie A and Rommesmo Daniel
Current Estimated Value
Home Financials for this Owner
Home Financials are based on the most recent Mortgage that was taken out on this home.
Original Mortgage
$250,260
Outstanding Balance
$226,579
Interest Rate
2.9%
Mortgage Type
New Conventional
Estimated Equity
$67,914
Purchase Details
Closed on
Nov 10, 2015
Sold by
Bremer Trust Na
Bought by
Johnson Connor B and Black Rachel A
Home Financials for this Owner
Home Financials are based on the most recent Mortgage that was taken out on this home.
Original Mortgage
$165,300
Interest Rate
3.82%
Mortgage Type
New Conventional
Purchase Details
Closed on
Oct 11, 2007
Sold by
Witt Richard J and Witt Colleen G
Bought by
Bremer Trust N A and Richard J Witt Living Trust
Create a Home Valuation Report for This Property
The Home Valuation Report is an in-depth analysis detailing your home's value as well as a comparison with similar homes in the area
Home Values in the Area
Average Home Value in this Area
Purchase History
| Date | Buyer | Sale Price | Title Company |
|---|---|---|---|
| Rommesmo Katie A | $260,000 | Fm Title | |
| Johnson Connor B | $174,000 | None Available | |
| Bremer Trust N A | -- | None Available |
Source: Public Records
Mortgage History
| Date | Status | Borrower | Loan Amount |
|---|---|---|---|
| Open | Rommesmo Katie A | $250,260 | |
| Previous Owner | Johnson Connor B | $165,300 |
Source: Public Records
Tax History Compared to Growth
Tax History
| Year | Tax Paid | Tax Assessment Tax Assessment Total Assessment is a certain percentage of the fair market value that is determined by local assessors to be the total taxable value of land and additions on the property. | Land | Improvement |
|---|---|---|---|---|
| 2024 | $3,362 | $134,000 | $26,550 | $107,450 |
| 2023 | $3,681 | $127,950 | $26,550 | $101,400 |
| 2022 | $3,541 | $120,700 | $26,550 | $94,150 |
| 2021 | $3,388 | $117,200 | $26,550 | $90,650 |
| 2020 | $3,004 | $109,550 | $26,550 | $83,000 |
| 2019 | $2,883 | $109,550 | $14,750 | $94,800 |
| 2018 | $2,537 | $97,650 | $14,750 | $82,900 |
| 2017 | $2,436 | $94,800 | $14,750 | $80,050 |
| 2016 | $2,164 | $86,200 | $14,750 | $71,450 |
| 2015 | $2,307 | $86,200 | $11,050 | $75,150 |
| 2014 | $2,139 | $77,200 | $11,050 | $66,150 |
| 2013 | $2,054 | $73,500 | $11,050 | $62,450 |
Source: Public Records
Map
Nearby Homes
- 2214 9 1 2 St N
- 1914 9th St N
- 2510 10th St N
- 418 25th Ave N
- 310 27th Ave N
- 305 19th Ave N
- 207 23rd Ave N
- 1822 3rd St N
- 3216 Broadway N
- 314 18th Ave N
- 2512 2nd St N
- 501 Forest Ave N Unit C
- 1645 Broadway N
- 2807 Edgewood Dr N
- 1626 Broadway N
- 2902 3rd St N
- 111 19th Ave N
- 1625 11th St N
- 1610 9th St N
- 1626 11th St N