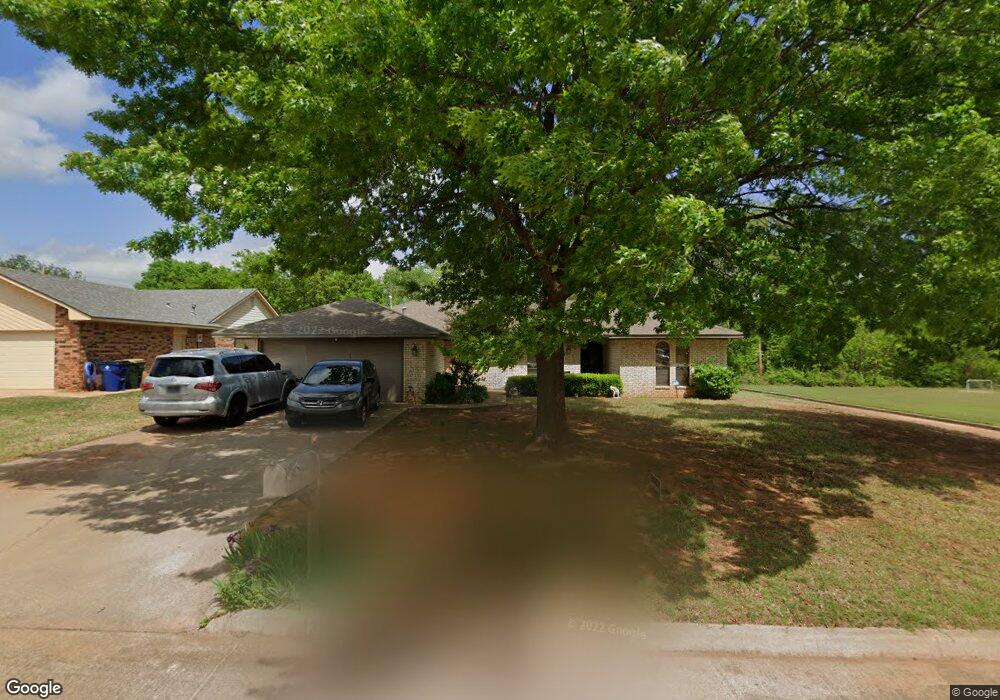
2202 Briarcrest Duncan, OK 73533
Estimated Value: $166,000 - $194,000
3
Beds
2
Baths
1,648
Sq Ft
$108/Sq Ft
Est. Value
About This Home
This home is located at 2202 Briarcrest, Duncan, OK 73533 and is currently estimated at $177,629, approximately $107 per square foot. 2202 Briarcrest is a home located in Stephens County with nearby schools including Horace Mann Elementary School, Duncan Middle School, and Duncan High School.
Ownership History
Date
Name
Owned For
Owner Type
Purchase Details
Closed on
Jul 26, 2019
Sold by
Taliaferro James Kenneth
Bought by
Pennypacker Rondell A and Pennypacker Kayla L
Current Estimated Value
Home Financials for this Owner
Home Financials are based on the most recent Mortgage that was taken out on this home.
Original Mortgage
$95,525
Outstanding Balance
$83,533
Interest Rate
3.73%
Mortgage Type
Future Advance Clause Open End Mortgage
Estimated Equity
$94,096
Purchase Details
Closed on
Oct 26, 2007
Sold by
Hart Roger W and Hart Paula K
Bought by
Taliaferro James Kenneth and Taliaferro Shirley A
Purchase Details
Closed on
Jul 21, 1997
Sold by
Crowl Charles T
Purchase Details
Closed on
May 22, 1996
Sold by
Davis Patrick F
Create a Home Valuation Report for This Property
The Home Valuation Report is an in-depth analysis detailing your home's value as well as a comparison with similar homes in the area
Purchase History
| Date | Buyer | Sale Price | Title Company |
|---|---|---|---|
| Pennypacker Rondell A | $95,000 | Stephens Co Abstract Co | |
| Taliaferro James Kenneth | -- | None Available | |
| -- | $75,000 | -- | |
| -- | $73,000 | -- |
Source: Public Records
Mortgage History
| Date | Status | Borrower | Loan Amount |
|---|---|---|---|
| Open | Pennypacker Rondell A | $95,525 |
Source: Public Records
Tax History
| Year | Tax Paid | Tax Assessment Tax Assessment Total Assessment is a certain percentage of the fair market value that is determined by local assessors to be the total taxable value of land and additions on the property. | Land | Improvement |
|---|---|---|---|---|
| 2025 | $1,217 | $14,427 | $1,235 | $13,192 |
| 2024 | $1,115 | $13,086 | $1,235 | $11,851 |
| 2023 | $1,115 | $13,085 | $1,235 | $11,850 |
| 2022 | $1,009 | $12,462 | $1,235 | $11,227 |
| 2021 | $987 | $11,599 | $1,235 | $10,364 |
| 2020 | $843 | $10,766 | $1,235 | $9,531 |
| 2019 | $947 | $11,948 | $1,235 | $10,713 |
| 2018 | $1,059 | $12,894 | $1,223 | $11,671 |
| 2017 | $990 | $12,621 | $1,235 | $11,386 |
| 2016 | $948 | $12,154 | $1,170 | $10,984 |
| 2015 | $912 | $11,800 | $1,146 | $10,654 |
| 2014 | $912 | $11,457 | $1,123 | $10,334 |
Source: Public Records
Map
Nearby Homes
- 1927 High Meadow Dr
- 2024 N Woodrock Dr
- 2021 Overland Dr
- NO ADDRESS W Plato Rd
- 1923 Windsor Dr
- 3990 N Ridgeview Dr
- 3885 N Ridgeview Dr
- 1829 Terrace Dr
- 2403 Meadow View Dr
- 2201 W Club Rd
- 2110 W Club Rd
- 2363 Rockwell Dr
- 2375 Rockwell Dr
- 2345 Rockwell Dr
- 2318 Rockwell Dr
- 1713 Wilshire Dr
- 2387 Rockwell Dr
- 2330 Rockwell Dr
- 2346 Rockwell Dr
- 2333 Rockwell Dr
- 2202 2202 Briarcrest
- 2206 Briarcrest
- 2210 Briarcrest
- 2201 Briarcrest
- 2205 Briarcrest
- 2214 Briarcrest
- 2209 Briarcrest
- 1902 Crestline Dr
- 2213 Briarcrest
- 1906 Crestline Dr
- 2302 Briarcrest
- 2302 2302 Briarcrest
- 2301 Briarcrest
- 2202 N Timbergate Rd
- 1907 High Meadow Dr
- 1910 Crestline Dr
- 2206 N Timbergate Rd
- 2210 N Timbergate Rd
- 2306 Briarcrest
- 1911 High Meadow Dr
Your Personal Tour Guide
Ask me questions while you tour the home.