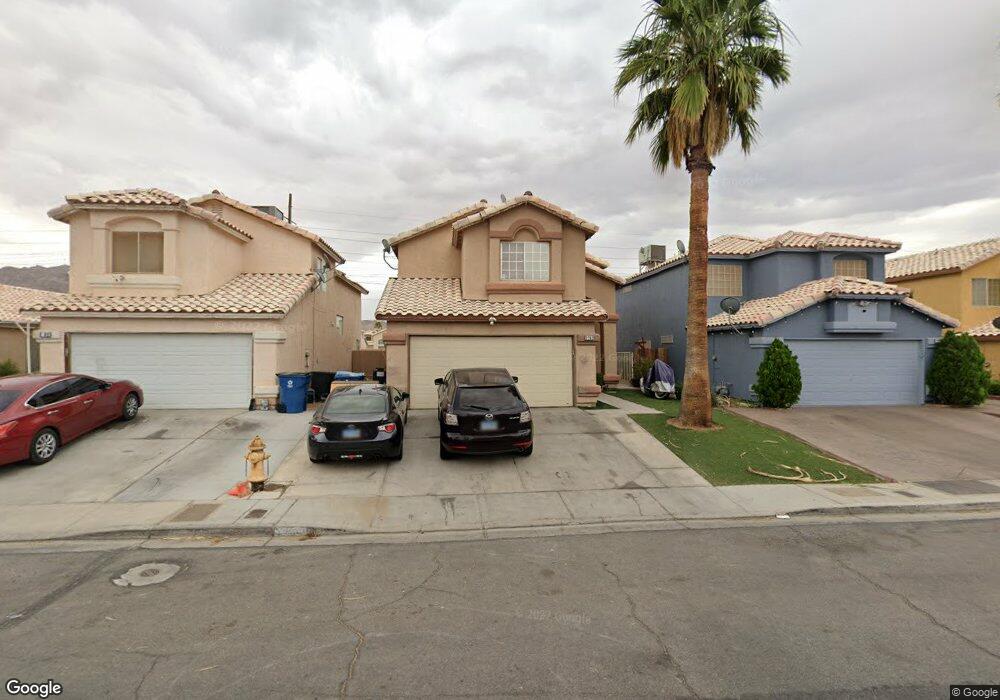
2202 Crowley Way Las Vegas, NV 89142
Estimated Value: $368,975 - $393,000
3
Beds
3
Baths
1,422
Sq Ft
$265/Sq Ft
Est. Value
About This Home
This home is located at 2202 Crowley Way, Las Vegas, NV 89142 and is currently estimated at $377,494, approximately $265 per square foot. 2202 Crowley Way is a home located in Clark County with nearby schools including John F. Mendoza Elementary School, Duane D. Keller Middle School, and Las Vegas High School.
Ownership History
Date
Name
Owned For
Owner Type
Purchase Details
Closed on
Nov 19, 1997
Sold by
Fernandez Mario and Fernandez Eneida
Bought by
Stark Scott K and Stark Eugenia
Current Estimated Value
Home Financials for this Owner
Home Financials are based on the most recent Mortgage that was taken out on this home.
Original Mortgage
$111,759
Outstanding Balance
$18,260
Interest Rate
7.23%
Mortgage Type
FHA
Estimated Equity
$359,234
Purchase Details
Closed on
Dec 1, 1994
Sold by
Fernandez Mario
Bought by
Fernandez Mario and Fernandez Eneida
Purchase Details
Closed on
Sep 30, 1994
Sold by
Menns Les and Menns Fran
Bought by
Fernandez Mario
Home Financials for this Owner
Home Financials are based on the most recent Mortgage that was taken out on this home.
Original Mortgage
$90,000
Interest Rate
6.25%
Purchase Details
Closed on
Sep 29, 1994
Sold by
Fernandez Eneida
Bought by
Fernandez Mario
Home Financials for this Owner
Home Financials are based on the most recent Mortgage that was taken out on this home.
Original Mortgage
$90,000
Interest Rate
6.25%
Create a Home Valuation Report for This Property
The Home Valuation Report is an in-depth analysis detailing your home's value as well as a comparison with similar homes in the area
Home Values in the Area
Average Home Value in this Area
Purchase History
| Date | Buyer | Sale Price | Title Company |
|---|---|---|---|
| Stark Scott K | $113,000 | Fidelity National Title | |
| Fernandez Mario | -- | -- | |
| Fernandez Mario | $100,000 | United Title | |
| Fernandez Mario | -- | United Title |
Source: Public Records
Mortgage History
| Date | Status | Borrower | Loan Amount |
|---|---|---|---|
| Open | Stark Scott K | $111,759 | |
| Previous Owner | Fernandez Mario | $90,000 |
Source: Public Records
Tax History Compared to Growth
Tax History
| Year | Tax Paid | Tax Assessment Tax Assessment Total Assessment is a certain percentage of the fair market value that is determined by local assessors to be the total taxable value of land and additions on the property. | Land | Improvement |
|---|---|---|---|---|
| 2025 | $994 | $69,645 | $22,750 | $46,895 |
| 2024 | $965 | $69,645 | $22,750 | $46,895 |
| 2023 | $965 | $71,035 | $26,250 | $44,785 |
| 2022 | $937 | $62,751 | $21,700 | $41,051 |
| 2021 | $910 | $59,187 | $19,950 | $39,237 |
| 2020 | $881 | $57,909 | $18,900 | $39,009 |
| 2019 | $870 | $54,658 | $16,100 | $38,558 |
| 2018 | $830 | $50,388 | $13,300 | $37,088 |
| 2017 | $1,393 | $47,496 | $9,800 | $37,696 |
| 2016 | $778 | $42,527 | $8,400 | $34,127 |
| 2015 | $776 | $31,101 | $5,600 | $25,501 |
| 2014 | $753 | $25,387 | $5,250 | $20,137 |
Source: Public Records
Map
Nearby Homes
- 2229 Bowstring Dr
- 2307 Tuscarora Ct
- 5650 E Sahara Ave Unit 2007
- 5650 E Sahara Ave Unit 1035
- 5849 Emerald Canyon Dr
- 1950 Turtlerock St
- 1841 Skywood Way
- 2306 Abarth St
- 5655 E Sahara Ave Unit 2048
- 5655 E Sahara Ave Unit 2009
- 5655 E Sahara Ave Unit 1003
- 5655 E Sahara Ave Unit 2068
- 5655 E Sahara Ave Unit 2020
- 2179 Raspberry Hill Rd
- 1927 Raspberry Hill Rd
- 1631 Mapleleaf St
- 1747 Angel Falls St
- 1950 Abarth St
- 6028 Las Nubes Dr
- 5857 Rainbow Bridge Dr
- 2192 Crowley Way
- 2212 Crowley Way
- 2182 Crowley Way
- 2220 Crowley Way
- 2228 Crowley Way
- 2172 Crowley Way
- 5789 Spoon Cir
- 2238 Crowley Way
- 2162 Crowley Way
- 5784 Sandtrap Ct
- 5781 Spoon Cir
- 5788 Spoon Cir
- 2248 Crowley Way
- 2152 Crowley Way
- 5776 Sandtrap Ct
- 5773 Spoon Cir
- 5780 Spoon Cir
- 2258 Crowley Way
- 5768 Sandtrap Ct
- 2142 Crowley Way