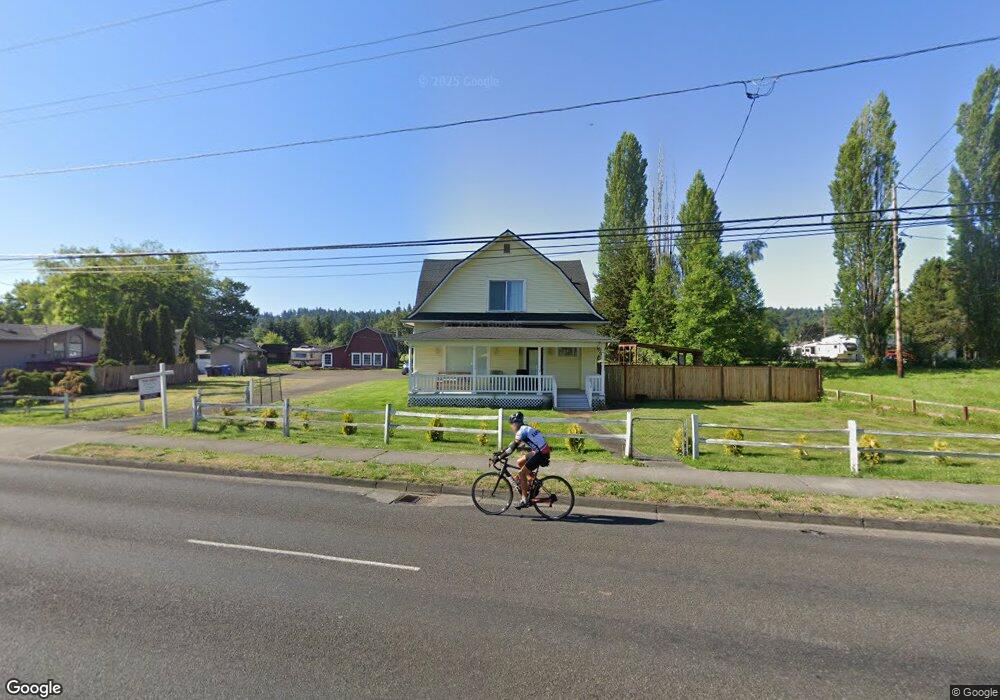
2202 E Pioneer Puyallup, WA 98372
Estimated Value: $778,129 - $912,000
4
Beds
2
Baths
3,464
Sq Ft
$244/Sq Ft
Est. Value
About This Home
This home is located at 2202 E Pioneer, Puyallup, WA 98372 and is currently estimated at $846,282, approximately $244 per square foot. 2202 E Pioneer is a home located in Pierce County with nearby schools including Shaw Road Elementary School, Kalles Junior High School, and Puyallup High School.
Ownership History
Date
Name
Owned For
Owner Type
Purchase Details
Closed on
Sep 11, 2020
Sold by
Ross Alishia
Bought by
Sekyra Kilcha
Current Estimated Value
Purchase Details
Closed on
Jul 14, 2017
Sold by
Thornegate Llc
Bought by
Ross Alishia
Home Financials for this Owner
Home Financials are based on the most recent Mortgage that was taken out on this home.
Original Mortgage
$459,000
Interest Rate
3.94%
Mortgage Type
New Conventional
Purchase Details
Closed on
Oct 27, 2011
Sold by
Douglas John B and Douglas Jill C
Bought by
Thornegate Llc
Purchase Details
Closed on
Jun 30, 2000
Sold by
Robinson Errol Wayne
Bought by
Douglas John B and Douglas Jill C
Purchase Details
Closed on
Aug 5, 1997
Sold by
Robinson Errol Wayne
Bought by
Robinson E Wayne and Robinson Mary Deanna
Create a Home Valuation Report for This Property
The Home Valuation Report is an in-depth analysis detailing your home's value as well as a comparison with similar homes in the area
Home Values in the Area
Average Home Value in this Area
Purchase History
| Date | Buyer | Sale Price | Title Company |
|---|---|---|---|
| Sekyra Kilcha | $660,000 | Ticor Title | |
| Ross Alishia | $509,719 | F A T C O | |
| Thornegate Llc | -- | Accommodation | |
| Douglas John B | $290,849 | -- | |
| Robinson E Wayne | -- | Chicago Title Insurance Co |
Source: Public Records
Mortgage History
| Date | Status | Borrower | Loan Amount |
|---|---|---|---|
| Previous Owner | Ross Alishia | $459,000 |
Source: Public Records
Tax History Compared to Growth
Tax History
| Year | Tax Paid | Tax Assessment Tax Assessment Total Assessment is a certain percentage of the fair market value that is determined by local assessors to be the total taxable value of land and additions on the property. | Land | Improvement |
|---|---|---|---|---|
| 2025 | $7,222 | $741,800 | $328,400 | $413,400 |
| 2024 | $7,222 | $770,900 | $330,700 | $440,200 |
| 2023 | $7,222 | $727,200 | $320,400 | $406,800 |
| 2022 | $6,856 | $750,400 | $351,400 | $399,000 |
| 2021 | $6,604 | $546,600 | $221,200 | $325,400 |
| 2019 | $5,553 | $506,800 | $198,400 | $308,400 |
| 2018 | $5,647 | $452,800 | $190,400 | $262,400 |
| 2017 | $5,301 | $408,400 | $160,800 | $247,600 |
| 2016 | $4,733 | $324,200 | $110,500 | $213,700 |
| 2014 | $4,124 | $312,100 | $103,600 | $208,500 |
| 2013 | $4,124 | $269,800 | $88,800 | $181,000 |
Source: Public Records
Map
Nearby Homes
- 1722 E Pioneer Unit 8
- 1706 E Pioneer
- 507 15th St SE
- 0 XXXX Shaw Rd & E Pioneer
- 1401 Park Ave
- 1602 12th Ave SE
- 310 13th St SE
- 118 12th St SE
- 1600 24th Street Place SE
- 6501 119th Ave E
- 1002 9th Ave SE Unit C201
- 3114 Highlands Blvd
- 6412 121st Ave E
- 1810 Brookmonte Dr SE
- 11948 64th St E
- 2702 17th Ave SE
- 1501 13th St SE
- 1803 Brookmonte Dr SE
- 617 7th St SE Unit 13
- 1835 Brookmonte Dr SE