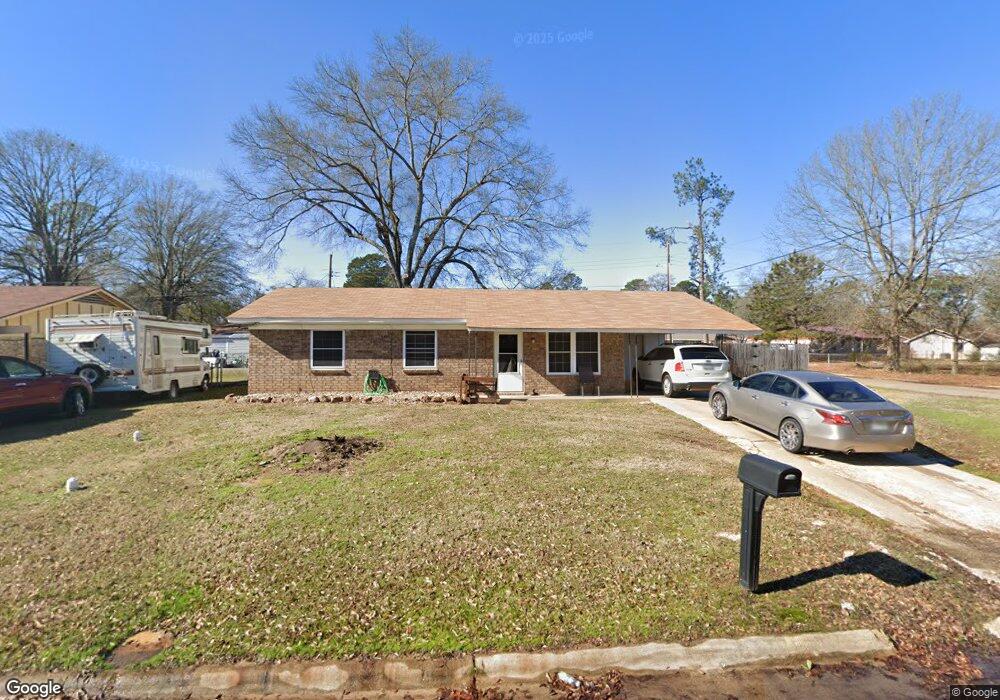
2202 Handley St Texarkana, TX 75501
Estimated Value: $91,000 - $105,000
--
Bed
--
Bath
960
Sq Ft
$102/Sq Ft
Est. Value
About This Home
This home is located at 2202 Handley St, Texarkana, TX 75501 and is currently estimated at $97,752, approximately $101 per square foot. 2202 Handley St is a home located in Bowie County with nearby schools including Liberty-Eylau Early Childhood Center, Liberty-Eylau C.K. Bender Elementary Campus, and Liberty-Eylau Primary School.
Ownership History
Date
Name
Owned For
Owner Type
Purchase Details
Closed on
Jul 21, 2025
Sold by
Levingston Ceretha Ann and Brown Ceretha Ann
Bought by
Ca Brown Holdings Llc
Current Estimated Value
Purchase Details
Closed on
Mar 19, 2020
Sold by
Spencer Robert James and Spencer Sharon Ann
Bought by
Levingston Ceretha Ann
Home Financials for this Owner
Home Financials are based on the most recent Mortgage that was taken out on this home.
Original Mortgage
$42,400
Interest Rate
3.4%
Mortgage Type
New Conventional
Purchase Details
Closed on
Apr 27, 2012
Sold by
Arnold Vera Diane
Bought by
Spencer Robert James and Spencer Sharon Ann
Home Financials for this Owner
Home Financials are based on the most recent Mortgage that was taken out on this home.
Original Mortgage
$33,000
Interest Rate
4.11%
Mortgage Type
Purchase Money Mortgage
Create a Home Valuation Report for This Property
The Home Valuation Report is an in-depth analysis detailing your home's value as well as a comparison with similar homes in the area
Home Values in the Area
Average Home Value in this Area
Purchase History
| Date | Buyer | Sale Price | Title Company |
|---|---|---|---|
| Ca Brown Holdings Llc | -- | Twin City Title | |
| Levingston Ceretha Ann | -- | Attorney | |
| Spencer Robert James | -- | Twin City Title |
Source: Public Records
Mortgage History
| Date | Status | Borrower | Loan Amount |
|---|---|---|---|
| Previous Owner | Levingston Ceretha Ann | $42,400 | |
| Previous Owner | Spencer Robert James | $33,000 |
Source: Public Records
Tax History Compared to Growth
Tax History
| Year | Tax Paid | Tax Assessment Tax Assessment Total Assessment is a certain percentage of the fair market value that is determined by local assessors to be the total taxable value of land and additions on the property. | Land | Improvement |
|---|---|---|---|---|
| 2025 | $1,668 | $81,642 | $8,000 | $73,642 |
| 2024 | $1,668 | $79,547 | $8,000 | $71,547 |
| 2023 | $1,441 | $68,146 | $5,000 | $63,146 |
| 2022 | $1,444 | $61,545 | $5,000 | $56,545 |
| 2021 | $1,307 | $52,245 | $5,000 | $47,245 |
| 2020 | $1,259 | $50,035 | $5,000 | $45,035 |
| 2019 | $1,309 | $50,113 | $5,000 | $45,113 |
| 2018 | $1,265 | $48,409 | $5,000 | $43,409 |
| 2017 | $1,239 | $47,579 | $5,000 | $42,579 |
| 2016 | $1,269 | $48,711 | $5,000 | $43,711 |
| 2015 | $1,171 | $48,291 | $5,000 | $43,291 |
| 2014 | $1,171 | $46,669 | $5,000 | $41,669 |
Source: Public Records
Map
Nearby Homes
- 3007 Post St
- 3009 Post St
- 1407 S Lake Dr
- 3007 Hollywood St
- 2803 Johnson Ln
- 1716 S Robison Rd
- 1605 S Robison Rd
- 3305 S Lake Dr
- 1215 S Lake Dr
- 1801 S Lake Dr
- 2120 Flower Acre Rd
- 2802 Flower Acre Rd
- 0 S Robison Rd
- 3610 Davis St
- 0 Buchanan Rd
- 0 Tbd 1 Ann St
- 0 Tbd 1 St W Unit 116362
- 2122 Parkham St
- 1309 West St
- 1306 Caldwell St