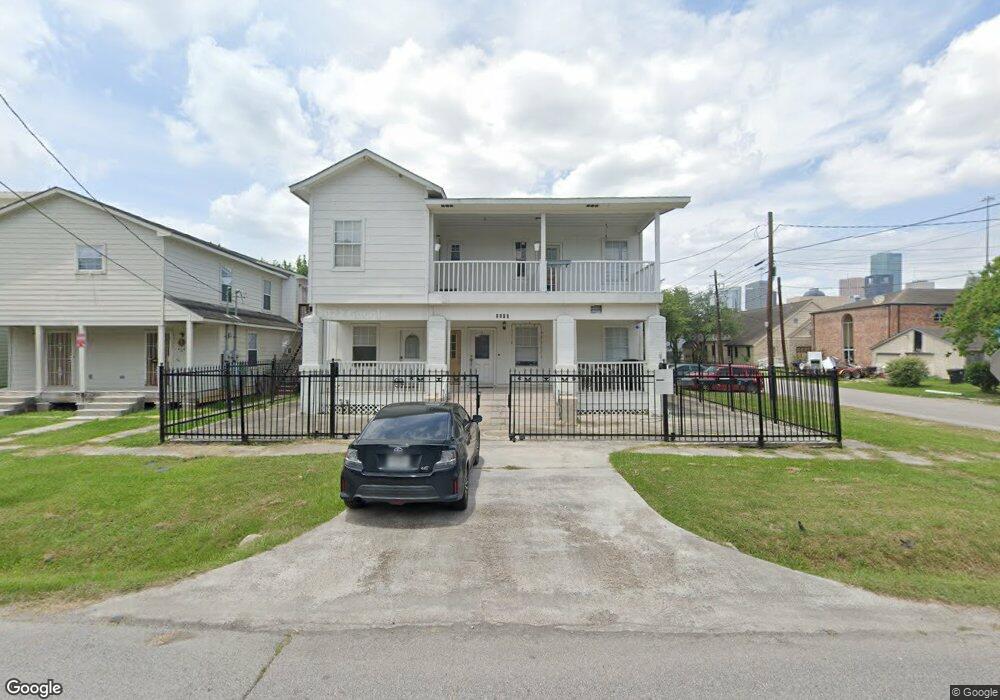
2202 Hutchins St Unit C,D,& E Houston, TX 77003
Third Ward NeighborhoodEstimated Value: $361,000 - $973,000
2
Beds
2
Baths
1,275
Sq Ft
$454/Sq Ft
Est. Value
About This Home
This home is located at 2202 Hutchins St Unit C,D,& E, Houston, TX 77003 and is currently estimated at $579,232, approximately $454 per square foot. 2202 Hutchins St Unit C,D,& E is a home located in Harris County with nearby schools including Blackshear Elementary School, Cullen Middle School, and Yates High School.
Ownership History
Date
Name
Owned For
Owner Type
Purchase Details
Closed on
Oct 30, 2024
Sold by
Pham Quang H and Pham Thai H
Bought by
Magnolia Tx Llc-Tx Hazel Protected Series
Current Estimated Value
Purchase Details
Closed on
Aug 30, 2024
Sold by
Pham Sunny
Bought by
Pham Quang H and Pham Thai H
Home Financials for this Owner
Home Financials are based on the most recent Mortgage that was taken out on this home.
Original Mortgage
$380,000
Interest Rate
6%
Mortgage Type
Seller Take Back
Purchase Details
Closed on
May 1, 2024
Sold by
Bennett Arthur
Bought by
Bennett Hyacinth
Purchase Details
Closed on
Jan 28, 2022
Sold by
Xuan Pham
Bought by
Pham Sunny
Purchase Details
Closed on
Jun 23, 1998
Sold by
Baul George D
Bought by
Pham Xuan and Pham Thien
Create a Home Valuation Report for This Property
The Home Valuation Report is an in-depth analysis detailing your home's value as well as a comparison with similar homes in the area
Home Values in the Area
Average Home Value in this Area
Purchase History
| Date | Buyer | Sale Price | Title Company |
|---|---|---|---|
| Magnolia Tx Llc-Tx Hazel Protected Series | -- | None Listed On Document | |
| Pham Quang H | -- | Charter Title Company | |
| Bennett Hyacinth | -- | None Listed On Document | |
| Pham Sunny | -- | None Listed On Document | |
| Pham Xuan | -- | Stewart Title |
Source: Public Records
Mortgage History
| Date | Status | Borrower | Loan Amount |
|---|---|---|---|
| Previous Owner | Pham Quang H | $380,000 |
Source: Public Records
Tax History Compared to Growth
Tax History
| Year | Tax Paid | Tax Assessment Tax Assessment Total Assessment is a certain percentage of the fair market value that is determined by local assessors to be the total taxable value of land and additions on the property. | Land | Improvement |
|---|---|---|---|---|
| 2025 | $8,775 | $439,369 | $220,000 | $219,369 |
| 2024 | $8,775 | $419,369 | $200,000 | $219,369 |
| 2023 | $8,775 | $407,190 | $200,000 | $207,190 |
| 2022 | $6,904 | $298,000 | $175,000 | $123,000 |
| 2021 | $6,966 | $298,900 | $150,000 | $148,900 |
| 2020 | $7,109 | $280,250 | $150,000 | $130,250 |
| 2019 | $5,688 | $215,000 | $125,000 | $90,000 |
| 2018 | $5,440 | $215,000 | $125,000 | $90,000 |
| 2017 | $6,080 | $230,000 | $125,000 | $105,000 |
| 2016 | $6,080 | $230,000 | $125,000 | $105,000 |
| 2015 | $3,342 | $178,000 | $75,000 | $103,000 |
| 2014 | $3,342 | $130,000 | $75,000 | $55,000 |
Source: Public Records
Map
Nearby Homes
- 2212 Hutchins St
- 2115 Hadley St
- 2209 Bastrop St
- 2205 Bastrop St
- 2109 Gray St
- 2303 Hadley St
- 2123 Mcilhenny St
- 2317 Hutchins St
- 2325 Hutchins St
- 2366 Bastrop St
- 2404 Hadley St Unit C
- 2113 Emancipation Ave
- 2105 Emancipation Ave
- 2409 Webster St
- 2117 Emancipation Ave
- 2212 Mcgowen St
- 2020 Mcgowen St Unit E
- 2408 Saint Charles St
- 2216 Chenevert St Unit 3
- 2320 Live Oak St
- 2202 Hutchins St
- 2202 Hutchins St Unit B
- 2202 Hutchins St Unit D
- 2202 Hutchins St Unit C
- 2204 Hutchins St
- 2110 Webster St
- 2206 Hutchins St
- 2106 Webster St
- 2120 Hutchins St
- 2210 Hutchins St
- 2104 Webster St
- 2203 Saint Emanuel St
- 2203 St Emanuel St
- 2208 Hutchins St
- 2204 Webster St
- 2208 Webster St
- 2205 St Emanuel St
- 2205 St Emanuel St Unit 2
- 2205 Saint Emanuel St Unit 1
- 2102 Webster St