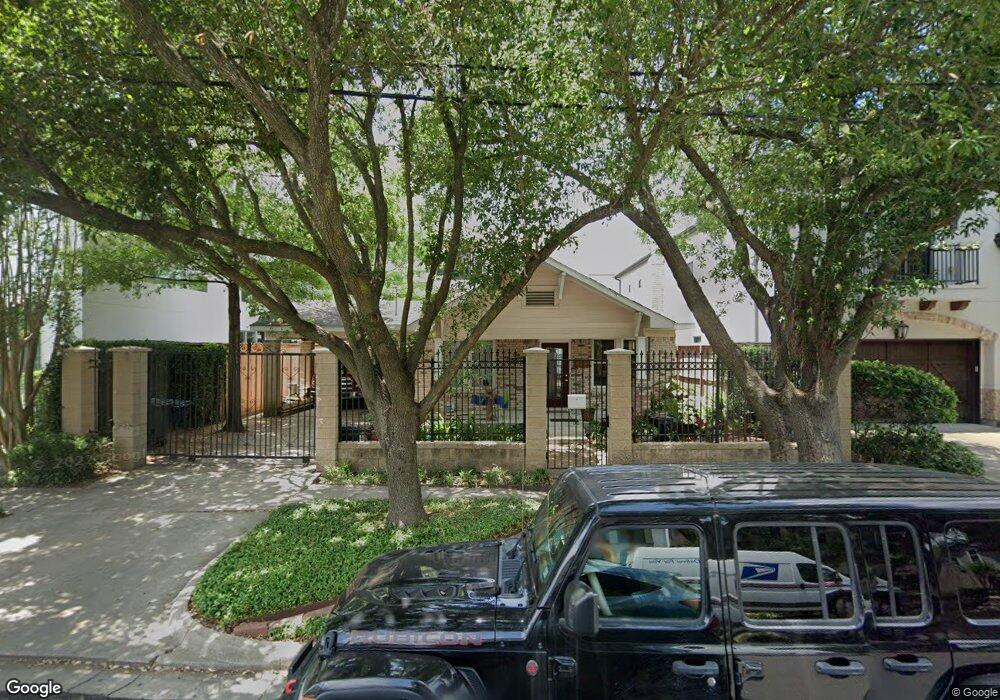
2202 Morse St Houston, TX 77019
Montrose NeighborhoodEstimated Value: $777,000 - $1,103,000
2
Beds
1
Bath
3,995
Sq Ft
$247/Sq Ft
Est. Value
About This Home
This home is located at 2202 Morse St, Houston, TX 77019 and is currently estimated at $986,153, approximately $246 per square foot. 2202 Morse St is a home located in Harris County with nearby schools including Baker Montessori, Lanier Middle School, and Lamar High School.
Ownership History
Date
Name
Owned For
Owner Type
Purchase Details
Closed on
Mar 27, 2012
Sold by
K Hovnanian Of Houston Ii Llc
Bought by
Khan Sonya
Current Estimated Value
Home Financials for this Owner
Home Financials are based on the most recent Mortgage that was taken out on this home.
Original Mortgage
$378,000
Outstanding Balance
$158,072
Interest Rate
3.91%
Mortgage Type
New Conventional
Estimated Equity
$828,081
Purchase Details
Closed on
Oct 31, 2011
Sold by
Larkey Rosylyn R
Bought by
Larkey Frank R
Purchase Details
Closed on
Mar 22, 1996
Sold by
Towber Preston T and Towber Laura G
Bought by
Larkey Roslyn R
Home Financials for this Owner
Home Financials are based on the most recent Mortgage that was taken out on this home.
Original Mortgage
$110,000
Interest Rate
7.02%
Create a Home Valuation Report for This Property
The Home Valuation Report is an in-depth analysis detailing your home's value as well as a comparison with similar homes in the area
Home Values in the Area
Average Home Value in this Area
Purchase History
| Date | Buyer | Sale Price | Title Company |
|---|---|---|---|
| Khan Sonya | -- | None Available | |
| Larkey Frank R | -- | None Available | |
| Larkey Roslyn R | -- | American Title Company |
Source: Public Records
Mortgage History
| Date | Status | Borrower | Loan Amount |
|---|---|---|---|
| Open | Khan Sonya | $378,000 | |
| Previous Owner | Larkey Roslyn R | $110,000 |
Source: Public Records
Tax History Compared to Growth
Tax History
| Year | Tax Paid | Tax Assessment Tax Assessment Total Assessment is a certain percentage of the fair market value that is determined by local assessors to be the total taxable value of land and additions on the property. | Land | Improvement |
|---|---|---|---|---|
| 2025 | $7,564 | $866,291 | $625,000 | $241,291 |
| 2024 | $7,564 | $838,721 | $625,000 | $213,721 |
| 2023 | $7,564 | $868,287 | $625,000 | $243,287 |
| 2022 | $15,479 | $731,781 | $550,000 | $181,781 |
| 2021 | $14,895 | $639,070 | $475,000 | $164,070 |
| 2020 | $16,387 | $676,717 | $475,000 | $201,717 |
| 2019 | $17,983 | $710,683 | $475,000 | $235,683 |
| 2018 | $10,262 | $679,608 | $410,000 | $269,608 |
| 2017 | $17,825 | $671,748 | $410,000 | $261,748 |
| 2016 | $16,932 | $671,748 | $410,000 | $261,748 |
| 2015 | $10,722 | $671,748 | $410,000 | $261,748 |
| 2014 | $10,722 | $620,321 | $340,000 | $280,321 |
Source: Public Records
Map
Nearby Homes
- 2309 Driscoll St
- 2103 Hazard St
- 2026 Morse St
- 2112 Mcduffie St
- 2003 Morse St
- 2008 Hazard St
- 2011 Woodhead St
- 2314 Park St
- 2505 Mcduffie St Unit B
- 2415 Elmen St
- 2117 Huldy St
- 2113 Huldy St
- 2119 Huldy St
- 2115 Huldy St
- 1906 Woodhead St
- 2315 Huldy St
- 2027 Huldy St
- 1822 Morse St Unit A
- 2025 Park St
- 1956 Vermont St
- 2206 Morse St
- 2118 Morse St
- 2201 Driscoll St Unit 3
- 2201 Driscoll St Unit 1
- 2201 Driscoll St Unit 6
- 2201 Driscoll St Unit 5
- 2201 Driscoll St Unit 2
- 2201 Driscoll St Unit 4
- 2114 Morse St
- 2117 Driscoll St
- 2117 Driscoll St
- 2203 Driscoll St
- 2203 Driscoll St Unit 2203
- 2203 Driscoll St
- 2205 Driscoll St
- 2115 Driscoll St
- 2208 Morse St Unit 12
- 2208 Morse St Unit 1
- 2208 Morse St Unit 4
- 2208 Morse St Unit 6