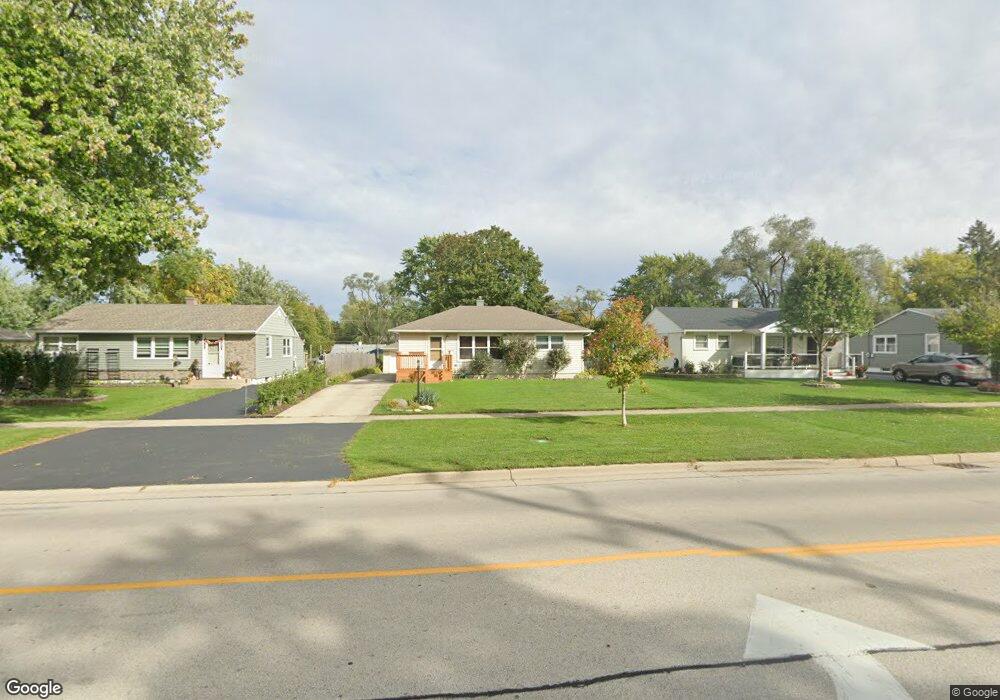
2202 Rohlwing Rd Rolling Meadows, IL 60008
Estimated Value: $310,000 - $369,000
4
Beds
2
Baths
1,200
Sq Ft
$289/Sq Ft
Est. Value
About This Home
This home is located at 2202 Rohlwing Rd, Rolling Meadows, IL 60008 and is currently estimated at $347,250, approximately $289 per square foot. 2202 Rohlwing Rd is a home located in Cook County with nearby schools including Kimball Hill Elementary School, Carl Sandburg Junior High School, and Rolling Meadows High School.
Ownership History
Date
Name
Owned For
Owner Type
Purchase Details
Closed on
Oct 28, 2025
Sold by
Ingratta Becky and Patch Becky
Bought by
Ingratta Becky
Current Estimated Value
Purchase Details
Closed on
May 1, 2014
Sold by
Pop Teodor and Pop Teador
Bought by
Calin D Pope Revocable Trust
Purchase Details
Closed on
Feb 20, 2004
Sold by
Doerpinghaus Todd L and Doerpinghaus Marie L
Bought by
Pop Teador
Home Financials for this Owner
Home Financials are based on the most recent Mortgage that was taken out on this home.
Original Mortgage
$125,000
Interest Rate
4.87%
Mortgage Type
Unknown
Purchase Details
Closed on
Feb 16, 1994
Sold by
Nunez Flavio and Valencia Elisa
Bought by
Doerpinghaus Todd and Doerpinghaus Sharie L
Home Financials for this Owner
Home Financials are based on the most recent Mortgage that was taken out on this home.
Original Mortgage
$135,750
Interest Rate
8.78%
Mortgage Type
FHA
Create a Home Valuation Report for This Property
The Home Valuation Report is an in-depth analysis detailing your home's value as well as a comparison with similar homes in the area
Home Values in the Area
Average Home Value in this Area
Purchase History
| Date | Buyer | Sale Price | Title Company |
|---|---|---|---|
| Ingratta Becky | -- | None Listed On Document | |
| Calin D Pope Revocable Trust | -- | None Available | |
| Pop Teador | $234,000 | Atgf Inc | |
| Doerpinghaus Todd | $138,000 | -- |
Source: Public Records
Mortgage History
| Date | Status | Borrower | Loan Amount |
|---|---|---|---|
| Previous Owner | Pop Teador | $125,000 | |
| Previous Owner | Doerpinghaus Todd | $135,750 |
Source: Public Records
Tax History Compared to Growth
Tax History
| Year | Tax Paid | Tax Assessment Tax Assessment Total Assessment is a certain percentage of the fair market value that is determined by local assessors to be the total taxable value of land and additions on the property. | Land | Improvement |
|---|---|---|---|---|
| 2025 | $8,275 | $28,000 | $6,552 | $21,448 |
| 2024 | $8,275 | $27,000 | $5,544 | $21,456 |
| 2023 | $7,925 | $27,000 | $5,544 | $21,456 |
| 2022 | $7,925 | $27,000 | $5,544 | $21,456 |
| 2021 | $6,639 | $20,048 | $3,276 | $16,772 |
| 2020 | $6,483 | $20,048 | $3,276 | $16,772 |
| 2019 | $6,517 | $22,401 | $3,276 | $19,125 |
| 2018 | $6,816 | $21,045 | $3,024 | $18,021 |
| 2017 | $5,607 | $21,045 | $3,024 | $18,021 |
| 2016 | $5,483 | $21,045 | $3,024 | $18,021 |
| 2015 | $4,711 | $17,587 | $2,772 | $14,815 |
| 2014 | $4,616 | $17,587 | $2,772 | $14,815 |
| 2013 | $4,487 | $17,587 | $2,772 | $14,815 |
Source: Public Records
Map
Nearby Homes
- 2401 Rohlwing Rd
- 2600 Brookwood Way Dr Unit 316
- 2600 Brookwood Way Dr Unit 305
- 2600 Brookwood Unit 314
- 2650 Brookwood Way Dr Unit 108
- 4301 Euclid Ave
- 3255 Kirchoff Rd Unit 306
- 1 Harrogate on Oxford
- 3200 Thrush Ln
- 2202 Eastman St
- 208 Brookdale Ln
- 617 N Wilke Rd
- 3 E Orchard Ln
- 32 W Fern Ct Unit 116B
- 712-724 S Plum Grove Rd
- 2107 Kirchoff Rd
- 4101 Owl Dr
- 4795 Woodcliff Ln
- 724 S Plum Grove Rd
- 2100 Martin Ln
- 2204 Rohlwing Rd
- 2200 Rohlwing Rd
- 2206 Rohlwing Rd
- 2108 Rohlwing Rd
- 2203 Flicker Ln
- 2205 Flicker Ln
- 2201 Flicker Ln
- 2300 Rohlwing Rd
- 2106 Rohlwing Rd
- 2207 Flicker Ln
- 2109 Flicker Ln
- 2104 Rohlwing Rd
- 2302 Rohlwing Rd
- 2301 Flicker Ln
- 2201 Rohlwing Rd
- 2109 Rohlwing Rd
- 2105 Flicker Ln
- 2303 Flicker Ln
- 2205 Rohlwing Rd
- 2102 Rohlwing Rd