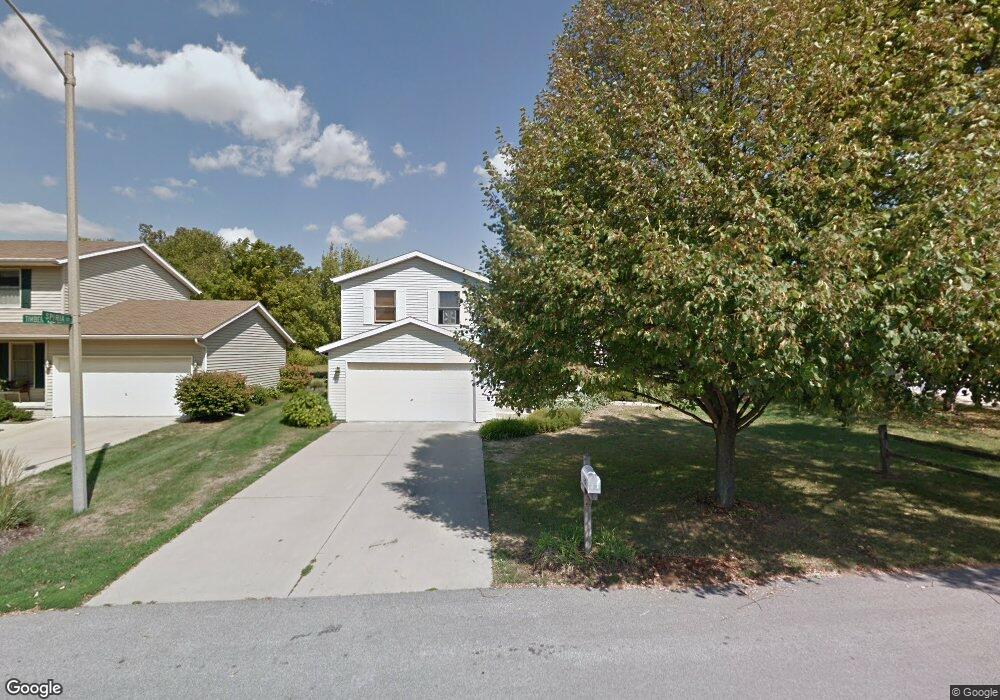
2202 Timber View Dr Bloomington, IL 61701
Oakwoods NeighborhoodEstimated Value: $238,000 - $252,000
3
Beds
2
Baths
1,568
Sq Ft
$155/Sq Ft
Est. Value
About This Home
This home is located at 2202 Timber View Dr, Bloomington, IL 61701 and is currently estimated at $243,378, approximately $155 per square foot. 2202 Timber View Dr is a home located in McLean County with nearby schools including Pepper Ridge Elementary School, Evans Junior High School, and Normal Community West High School.
Ownership History
Date
Name
Owned For
Owner Type
Purchase Details
Closed on
Jun 7, 2021
Sold by
Mustread Joshua and Mustread Cydney
Bought by
Althoff Alexander J and Althoff Carlyn D
Current Estimated Value
Home Financials for this Owner
Home Financials are based on the most recent Mortgage that was taken out on this home.
Original Mortgage
$168,150
Outstanding Balance
$152,239
Interest Rate
2.9%
Mortgage Type
New Conventional
Estimated Equity
$91,139
Purchase Details
Closed on
May 15, 2017
Sold by
Dabbs Matthew Charles and Dabbs Emily Ann
Bought by
Blankenship Cydney and Mustread Joshua
Home Financials for this Owner
Home Financials are based on the most recent Mortgage that was taken out on this home.
Original Mortgage
$13,600
Interest Rate
3.87%
Purchase Details
Closed on
Jul 9, 2009
Sold by
Anvick David and Anvick Felicia M
Bought by
Dabbs Matthew Charles and Dabbs Emily Ann
Home Financials for this Owner
Home Financials are based on the most recent Mortgage that was taken out on this home.
Original Mortgage
$159,035
Interest Rate
5.32%
Create a Home Valuation Report for This Property
The Home Valuation Report is an in-depth analysis detailing your home's value as well as a comparison with similar homes in the area
Home Values in the Area
Average Home Value in this Area
Purchase History
| Date | Buyer | Sale Price | Title Company |
|---|---|---|---|
| Althoff Alexander J | $177,000 | Ftc | |
| Blankenship Cydney | $144,000 | Alliance Land Title | |
| Dabbs Matthew Charles | $162,000 | Frontier Title Co |
Source: Public Records
Mortgage History
| Date | Status | Borrower | Loan Amount |
|---|---|---|---|
| Open | Althoff Alexander J | $168,150 | |
| Previous Owner | Blankenship Cydney | $13,600 | |
| Previous Owner | Dabbs Matthew Charles | $159,035 |
Source: Public Records
Tax History
| Year | Tax Paid | Tax Assessment Tax Assessment Total Assessment is a certain percentage of the fair market value that is determined by local assessors to be the total taxable value of land and additions on the property. | Land | Improvement |
|---|---|---|---|---|
| 2024 | $4,189 | $64,435 | $12,178 | $52,257 |
| 2022 | $4,189 | $53,403 | $10,093 | $43,310 |
| 2021 | $3,834 | $48,887 | $9,239 | $39,648 |
| 2020 | $3,758 | $47,976 | $9,067 | $38,909 |
| 2019 | $3,636 | $47,976 | $9,067 | $38,909 |
| 2018 | $3,632 | $47,976 | $9,067 | $38,909 |
| 2017 | $3,485 | $47,976 | $9,067 | $38,909 |
| 2016 | $3,475 | $47,976 | $9,067 | $38,909 |
| 2015 | $3,483 | $48,062 | $9,083 | $38,979 |
| 2014 | $3,444 | $48,062 | $9,083 | $38,979 |
| 2013 | -- | $46,662 | $8,818 | $37,844 |
Source: Public Records
Map
Nearby Homes
- 1513 6 Points Rd
- 1515 Six Points Rd
- 10 Timbers Ct
- 312 Clover Ct
- 1409 Butchers Ln
- 2311 Wirsing Way
- 26 Troy Ct
- 6 Leo Dr
- 1 Christine Way
- 2007 Fallen Oak Rd
- 2503 Treeline Dr
- 2404 Treeline Dr
- 2709 and 2711 Fox Trot Trail
- 2705 and 2707 Fox Trot Trail
- 28 Prairie Vista Ct
- 2405 Savanna Rd
- 202 Tanner St
- 501 Lutz Rd
- 2511 Savanna Rd
- 2505 Pampas Ln
- 2202 Timberview Dr
- 2108 Timber View Dr
- 2206 Timberview Dr
- 2206 Timber View Dr
- 2201 Timber View Dr
- 2106 Timberview Dr
- 2106 Timber View Dr
- 27 Edgewood Ct
- 17 Edgewood Ct
- 2103 Timber View Dr
- 2203 Timberview Dr
- 2203 Timber View Dr
- 4 Spiria Ct
- 2104 Timberview Dr
- 2104 Timber View Dr
- 15 Edgewood Ct
- 15 Edgewood Ct
- 3 Spiria Ct
- 33 Edgewood Ct
- 6 Spiria Ct
Your Personal Tour Guide
Ask me questions while you tour the home.