Estimated Value: $571,000 - $606,000
--
Bed
3
Baths
2,790
Sq Ft
$214/Sq Ft
Est. Value
About This Home
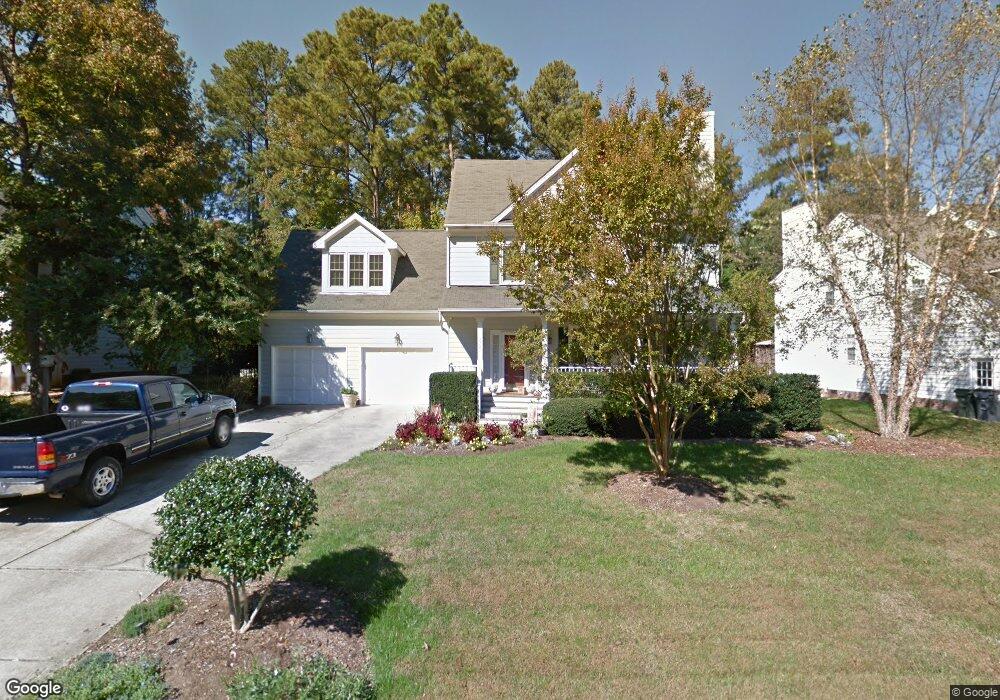
This home is located at 2202 Watersglen Dr, Apex, NC 27502 and is currently estimated at $596,393, approximately $213 per square foot. 2202 Watersglen Dr is a home located in Wake County with nearby schools including Penny Road Elementary School, Apex Middle, and Apex High School.
Ownership History
Date
Name
Owned For
Owner Type
Purchase Details
Closed on
Jun 5, 2006
Sold by
Slayton Jeffrey Andrew
Bought by
Slayton Jeffrey Andrew and Slayton Deborah Flaherty
Current Estimated Value
Purchase Details
Closed on
Jun 19, 1998
Sold by
Berkowitz Kathleen E Slayton and Berkowitz William F
Bought by
Slayton Jeffrey Andrew
Home Financials for this Owner
Home Financials are based on the most recent Mortgage that was taken out on this home.
Original Mortgage
$174,000
Outstanding Balance
$35,295
Interest Rate
7.21%
Estimated Equity
$561,098
Purchase Details
Closed on
Aug 26, 1996
Bought by
Slayton Jeffrey Andrew and Slayton Deborah Flaherty
Create a Home Valuation Report for This Property
The Home Valuation Report is an in-depth analysis detailing your home's value as well as a comparison with similar homes in the area
Home Values in the Area
Average Home Value in this Area
Purchase History
| Date | Buyer | Sale Price | Title Company |
|---|---|---|---|
| Slayton Jeffrey Andrew | -- | None Available | |
| Slayton Jeffrey Andrew | -- | -- | |
| Slayton Jeffrey Andrew | $190,000 | -- |
Source: Public Records
Mortgage History
| Date | Status | Borrower | Loan Amount |
|---|---|---|---|
| Open | Slayton Jeffrey Andrew | $174,000 |
Source: Public Records
Tax History Compared to Growth
Tax History
| Year | Tax Paid | Tax Assessment Tax Assessment Total Assessment is a certain percentage of the fair market value that is determined by local assessors to be the total taxable value of land and additions on the property. | Land | Improvement |
|---|---|---|---|---|
| 2025 | $4,989 | $569,118 | $180,000 | $389,118 |
| 2024 | $4,877 | $569,118 | $180,000 | $389,118 |
| 2023 | $4,198 | $380,891 | $90,000 | $290,891 |
| 2022 | $3,941 | $380,891 | $90,000 | $290,891 |
| 2021 | $3,791 | $380,891 | $90,000 | $290,891 |
| 2020 | $3,753 | $380,891 | $90,000 | $290,891 |
| 2019 | $3,564 | $312,078 | $90,000 | $222,078 |
| 2018 | $3,357 | $312,078 | $90,000 | $222,078 |
| 2017 | $3,125 | $312,078 | $90,000 | $222,078 |
| 2016 | $2,843 | $287,873 | $90,000 | $197,873 |
| 2015 | $2,609 | $257,780 | $60,000 | $197,780 |
| 2014 | $2,515 | $257,780 | $60,000 | $197,780 |
Source: Public Records
Map
Nearby Homes
- 2003 Chedington Dr
- 1209 Waterford Green Dr
- 809 Green Passage Ln
- 1511 Waterland Dr
- 644 Angelica Cir
- 938 Regency Cottage Place
- 1003 Sunny Brae Ct
- 214 Williams Grove Ln Unit Lot 4
- 218 Williams Grove Ln
- 226 Williams Grove Ln
- 262 Williams Grove Ln Unit Lot 76
- 278 Williams Grove Ln Unit Lot 73
- 286 Williams Grove Ln Unit Lot 71
- 294 Williams Grove Ln Unit 69
- 294 Williams Grove Ln
- 298 Williams Grove Ln N Unit 68
- 265 Williams Grove Ln
- 273 Williams Grove Ln Unit Lot 62
- 281 Williams Grove Ln Unit Lot 64
- 281 Williams Grove Ln
- 2200 Watersglen Dr
- 2204 Watersglen Dr
- 2300 Eagles Watch Ct
- 2302 Eagles Watch Ct
- 2206 Watersglen Dr
- 2113 Watersglen Dr
- 2203 Watersglen Dr
- 2205 Watersglen Dr
- 2304 Eagles Watch Ct
- 2205 Winpost Ln
- 2203 Winpost Ln
- 2207 Watersglen Dr
- 2208 Watersglen Dr
- 2111 Watersglen Dr
- 2201 Winpost Ln
- 2207 Winpost Ln
- 2306 Eagles Watch Ct
- 2206 Lilyford Ln
- 2209 Watersglen Dr
- 2208 Lilyford Ln